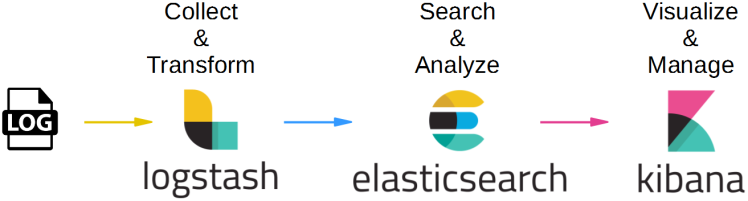
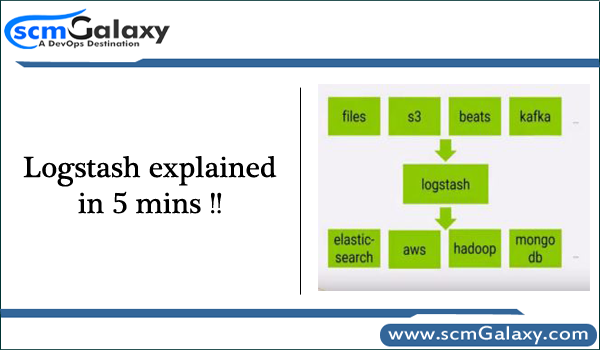
Logstash explained in 5 mins

What is Logstash?
Logstash is an open source, server-side data processing pipeline that ingests data from a multitude of sources simultaneously, transforms it, and then sends it to your favorite “stash.”

Logstash Benefits

  • Logstash allows you to easily ingest unstructured data from a variety of data sources including system logs, website logs, and application server logs.
  • Logstash offers pre-built filters, so you can readily transform common data types, index them in Elasticsearch, and start querying without having to build custom data transformation pipelines.
  • With over 200 plugins already available on Github, it is likely that someone has already built the plugin you need to customize your data pipeline.

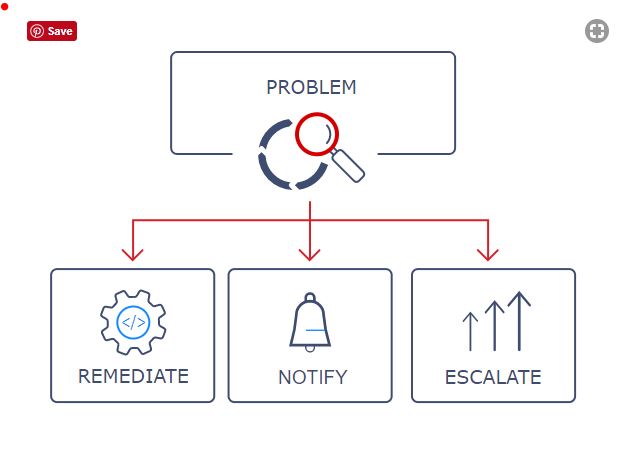
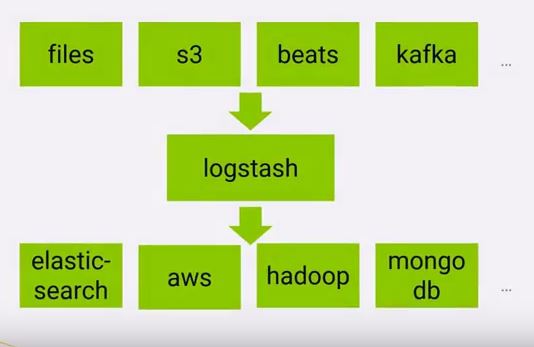
Logstash work in 3 phases….

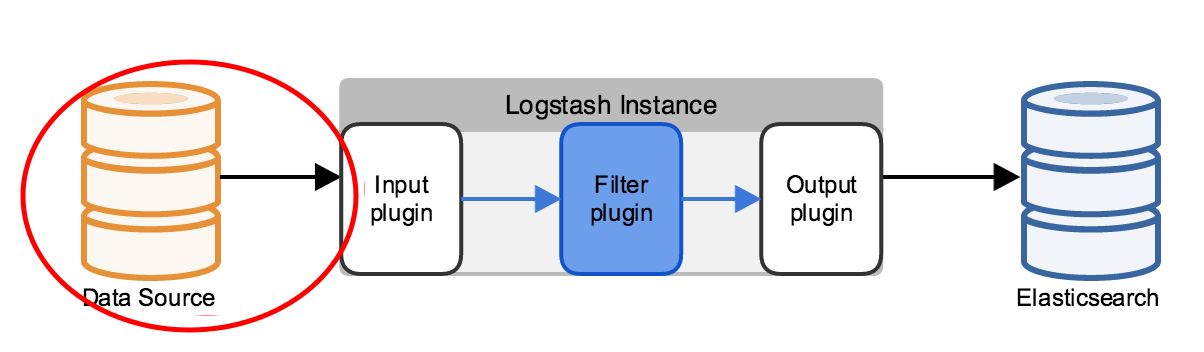
Phase 1 – When it comes from ingests data from a multitude of sources simultaneously, which includes files, s3,beats, kafka etc. Data is often scattered or siloed across many systems in many formats. Logstash supports a variety of inputs that pull in events from a multitude of common sources, all at the same time.
List of sources from where logstash can ingest the data are as follows;
https://www.elastic.co/guide/en/logstash/current/input-plugins.html

Phase 2 – Next, It Parse & Transform Your Data On the Fly. As data travels from source to store, Logstash filters parse each event, identify named fields to build structure, and transform them to converge on a common format for easier, accelerated analysis and business value. Logstash dynamically transforms and prepare your data regardless of format or complexity

Phase 3 – Last, Logstash stored the parsed data into Elasticsearch, aws,hadoop, Mongodb and go-to output that opens up a world of search and analytics possibilities.Logstash has a variety of outputs that let you route data where you want, giving you the flexibility to unlock a slew of downstream use cases. Some of these are given below;
https://www.elastic.co/guide/en/logstash/current/output-plugins.html

Where you can use the Logstash?

  1. Log Analytics – Ingest un-structured and semi-structured logs generated by servers, applications, mobile devices, and more for a wide variety of applications such as digital marketing, application monitoring, fraud detection, ad tech, gaming, and IoT. Logstash provides plugins to quickly load data from a variety of data sources.
  2. IT Operations Monitoring – Capture server logs and push them into your Elasticsearch cluster using Logstash. Elasticsearch indexes the data and makes it available for analysis in near real-time (less than one second). You can then use Kibana to visualize the data and perform operational analyses like identifying network issues and disk I/O problems. Your on-call teams can perform statistical aggregations to identify root cause and fix issues.
Tagged :

What is Zabbix and use of it?

What is Zabbix and use of it?

Zabbix is the ultimate enterprise-level software designed for real-time monitoring of millions of metrics collected from tens of thousands of servers, virtual machines and network devices. Zabbix is Open Source and comes at no cost. This tool is 19 years old along with 300 000+ installation worldwide. it has capability to monitor anything such as…

  1. Network Monitoring
  2. Server Monitoring
  3. Cloud Monitoring
  4. Services Monitoring
  5. KPI/SLA monitoring

Zabbix uses MySQL, PostgreSQL, SQLite, Oracle or IBM DB2 to store data. Its backend is written in C and the web frontend is written in PHP. Zabbix offers several monitoring options such as:

Collect metrics from any devices, systems, applications

  • Multi-platform Zabbix agent
  • SNMP and IPMI agents
  • Agentless monitoring of user services
  • Custom methods
  • Calculation and aggregation
  • End user web monitoring


PROBLEM DETECTION – Define smart thresholds
Detect problem states within the incoming metric flow automatically. No need to peer at incoming metrics continuously.

  • Highly flexible definition options
  • Separate problem conditions and resolution conditions
  • Multiple severity levels
  • Root cause analysis
  • Anomaly detection
  • Trend prediction

VISUALIZATION – Single pane of glass
The native web interface provides multiple ways of presenting a visual overview of your IT environment:

  • Widget-based dashboards
  • Graphs
  • Network maps
  • Slideshows
  • Drill-down reports

NOTIFICATION AND REMEDIATION – Be notified in case of any issues, guaranteed

Inform responsible persons about occurred events using many different channels and options:

  • Send messages
  • Let Zabbix fix issues automatically
  • Escalate problems according to flexible user-defined Service Levels
  • Customize messages based on recipient’s role
  • Customize messages with runtime and inventory information
  • Save yourself from thousands of repetitive notifications and focus on root causes of a problem with Zabbix
  • Event correlation mechanism.

SECURITY AND AUTHENTICATION – Protect your data on all levels

  • Strong encryption between all Zabbix components
  • Multiple authentication methods: Open LDAP, Active Directory
  • Flexible user permission schema
  • Zabbix code is open for security audits

EFFORTLESS DEPLOYMENT – Save your time by using out-of-the-box templates

  • Install Zabbix in minutes
  • Use out-of-the-box templates for most of popular platforms
  • Build custom templates
  • Use hundreds of templates built by Zabbix community
  • Apply for Template building service from Zabbix team
  • Monitor thousands of similar devices by using configuration templates

AUTO-DISCOVERY – Automate monitoring of large, dynamic environments

Take automatic actions upon adding/removing/changing elements.

  • Network discovery: periodically scans network and discovers device type, IP, status, uptime/downtime, etc, and takes predefined actions.
  • Low-level discovery: automatically creates items, triggers, and graphs for different elements on a device.
  • Auto-registration of active agent: automatically starts monitoring new equipment with Zabbix agent.

DISTRIBUTED MONITORING – Scale without limits

Build distributed monitoring solution while keeping centralized control.

  • Collect data from thousands of monitored devices
  • Monitor behind the firewall, DMZ
  • Collect data even in case of network issues
  • Remotely run custom scripts on monitored hosts

ZABBIX API – Integrate Zabbix with any part of your IT environment

Get access to all Zabbix functionality from external applications through Zabbix API:

  • Automate Zabbix management via API
  • 200+ different methods available
  • Create new applications to work with Zabbix
  • Integrate Zabbix with third party software: Configuration management, ticketing systems
  • Retrieve and manage configuration and historical data

Tagged :

Berkshelf in Chef explained?

Configuration Management using chef is being implemented with the help of desire files, which is often called a “cookbooks” in chef. Usuallay separate cookbooks is written in practice for each module so its easy to maintain. Also, there are good numbers of cookbooks which is being used from community portal which is from supermarket.chef.io.

In order to meet the desire state in servers, once the multile cookbooks is used, Very often these cookbooks become large and highly interdependent, it becomes necessary to manage these cookbooks itself.

Berkshelf is the tool which makes ‘the management’ & dependency management between cookbooks easy. Berkshelf is a dependency manager for Chef cookbooks. With it, you can easily depend on community cookbooks and have them safely included in your workflow. Using Berkshelf, you need to package, bundle dependent cookbooks rather using it will download from “source” which is defined in Berksfile.

Berkshelf is included in the Chef Development Kit.

Quick Start
Running “chef generate cookbook” will, by default, create a Berksfile in the root of the cookbook, alongside the cookbook’s metadata.rb. As usual, add your cookbook’s dependencies to the metadata:

name 'my_first_cookbook'
version '0.1.0'
depends 'apt', '~> 5.0'

The default Berksfile will contain the following:

source 'https://supermarket.chef.io'
metadata

Now, when you run “berks install“, the apt cookbook will be downloaded from Supermarket into the cache…

$ berks install
Resolving cookbook dependencies...
Fetching 'my_first_cookbook' from source at .
Fetching cookbook index from https://supermarket.chef.io...
Installing apt (5.0.0)
Using my_first_cookbook (0.1.0) from source at .
Installing compat_resource (12.16.2)

Example of Berksfile

source "https://supermarket.chef.io"

metadata
cookbook 'zabbix-agent', path: 'cookbooks/zabbix-agent'
cookbook 'hostnames', path: 'cookbooks/hostnames'
cookbook 'chef-client', path: 'cookbooks/chef-client'
cookbook 'rethinkdb', path: 'cookbooks/rethinkdb'
cookbook 'zookeeper', path: 'cookbooks/zookeeper'
cookbook 'logstash', path: 'cookbooks/logstash'
cookbook 'kafka', path: 'cookbooks/kafka'
cookbook 'elasticsearch', path: 'cookbooks/elasticsearch'
cookbook 'testbook', path: 'cookbooks/testbook'
cookbook 'base-ubuntu', path: 'cookbooks/base-ubuntu'

Important Notes
For new users, we strongly recommend using Policyfiles rather than Berkshelf. Policyfiles provide more predictability, since dependencies are only resolved once, and a much improved way of promoting cookbooks from dev to testing, and then to production. Note that Policyfile is not supported as part of a Chef Automate workflow.

Tagged : /