How to Uninstall/Remove Package in Laravel?

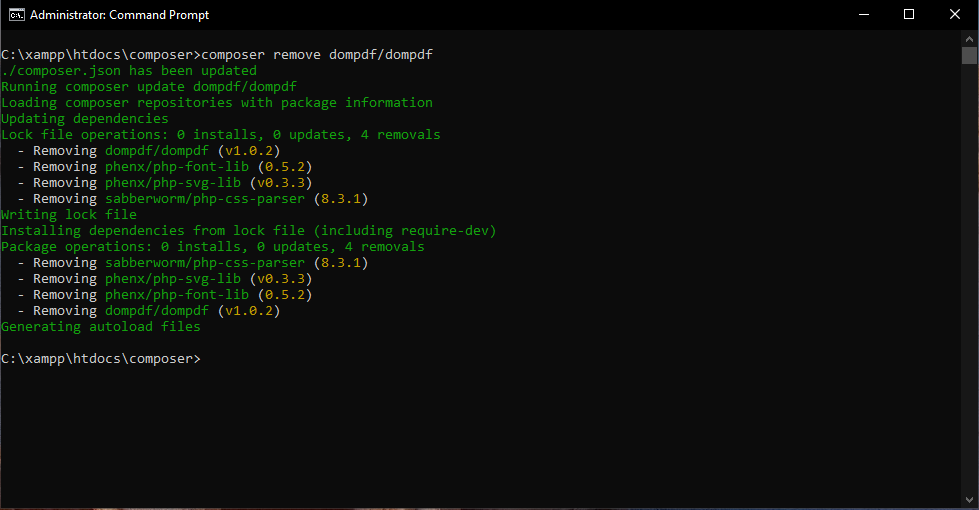
composer remove VenderName/PackageName – The remove command removes packages from the composer.json file from the current directory.

Syntax :- composer remove VenderName/PackageName

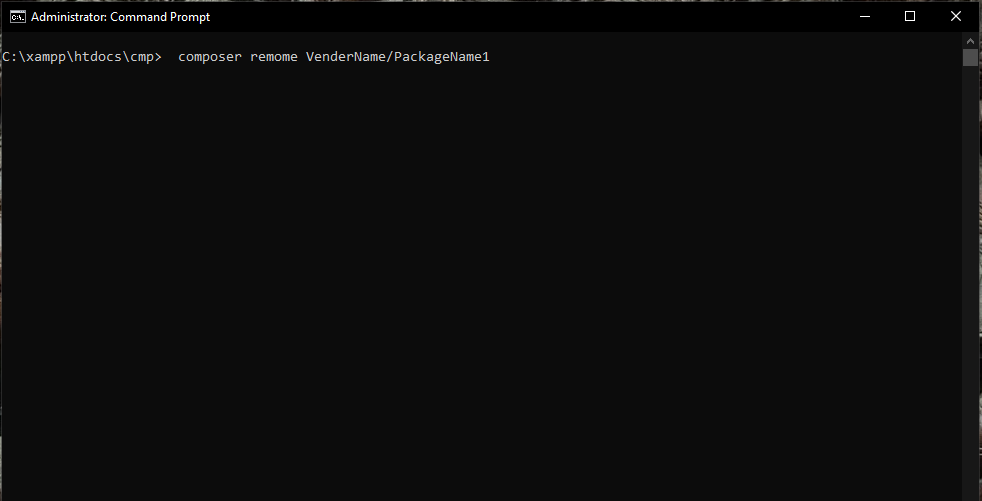
Syntax:- composer remome VenderName/PackageName1

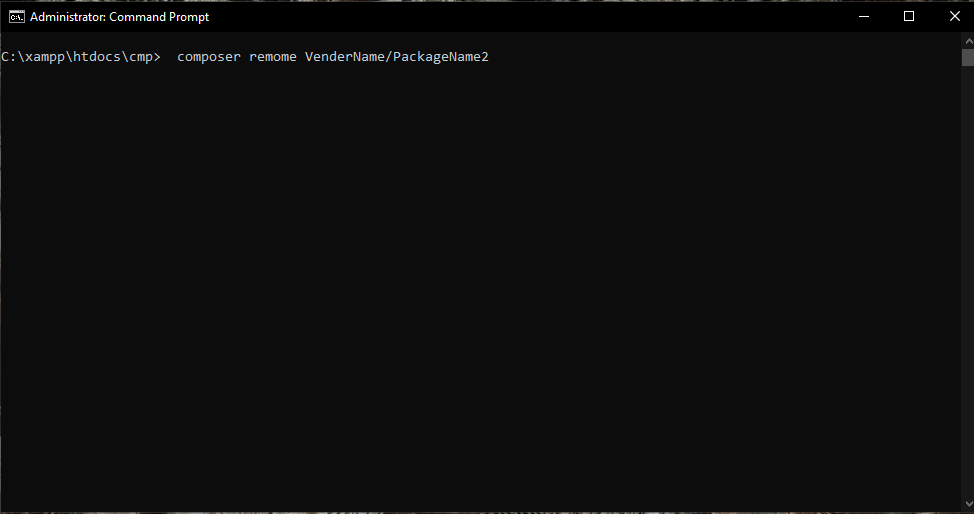
VenderName/PackageName2

If you want to remove more than one package then you have to run this command.

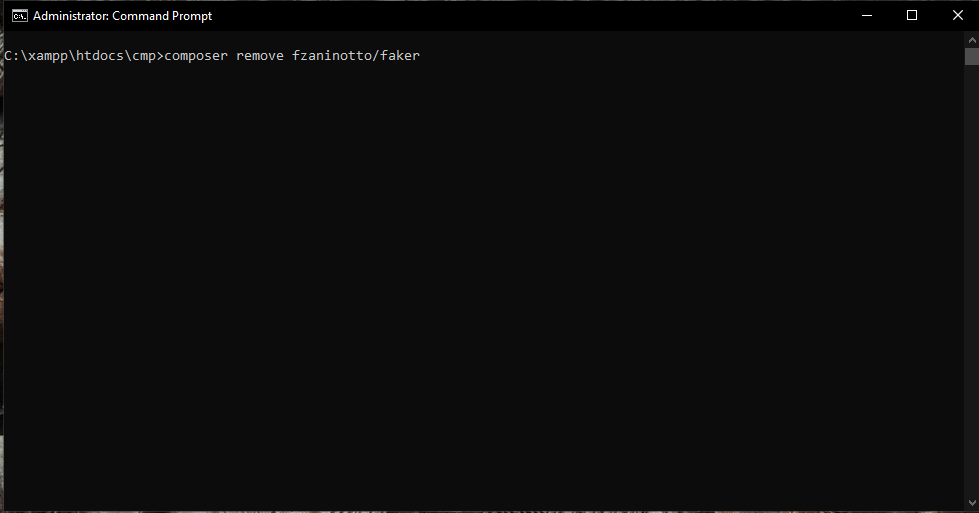
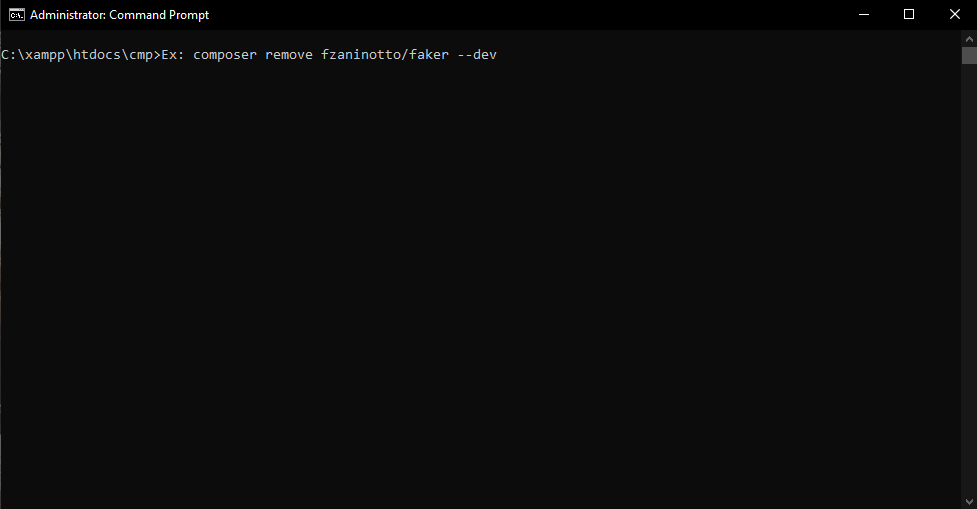
Ex:- composer remove fzaninotto/faker

–dev: It remove packages form require-dev

This means, if it is in require-dev, then you have to remove it from there, then for this, you have to flag the dev.

Ex: composer remove fzaninotto/faker –dev

Tagged : / / /

How to Install/Add-Package in Laravel?

composer require VendorName/PackageName – This command installs a package and any packages that it depends on.

syntaxexample
composer require VendorName/PackageNamecomposer require fzaninotto/faler
composer require VendorName/PackageName:tagcomposer require fzaninotto/faker:dev-master
composer require VendorName/PackageName:versioncomposer require fzaninotto/faker:1.9.0

–dev: Add packages to require-dev.

composer require VendorName/PackageName –dev

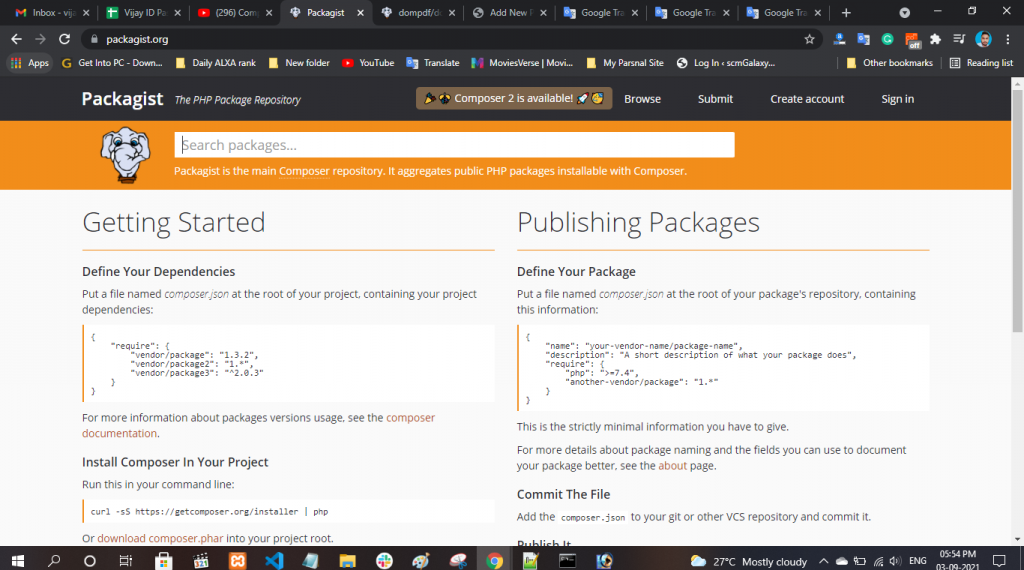
https://packagist.org/ This is the website, from where you will get Php packages. This is the package repository of Php. You have to open this site, whatever your requirement is, you can do that package.

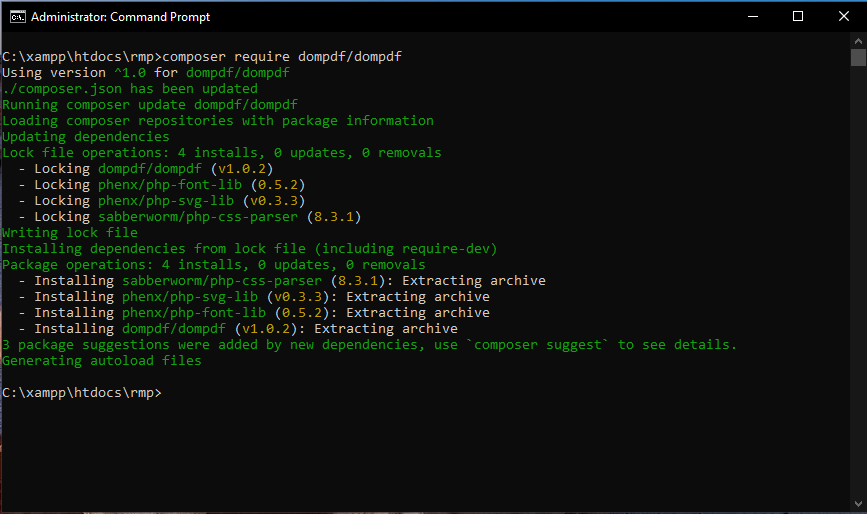
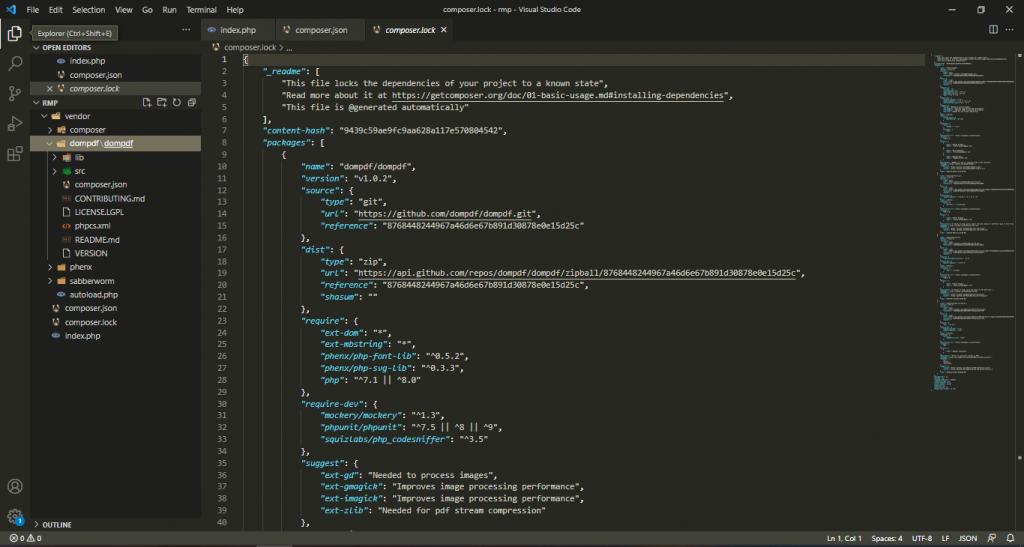
If you want a viewer with PDF, then you search by typing PDF. Here the first one wants Dompdf / Dompdf, so I clicked on it. After clicking on it, it will show you what is the version tag. And it will also show how to install it. So to install it, you have to type the command composer require dompdf/dompdf.

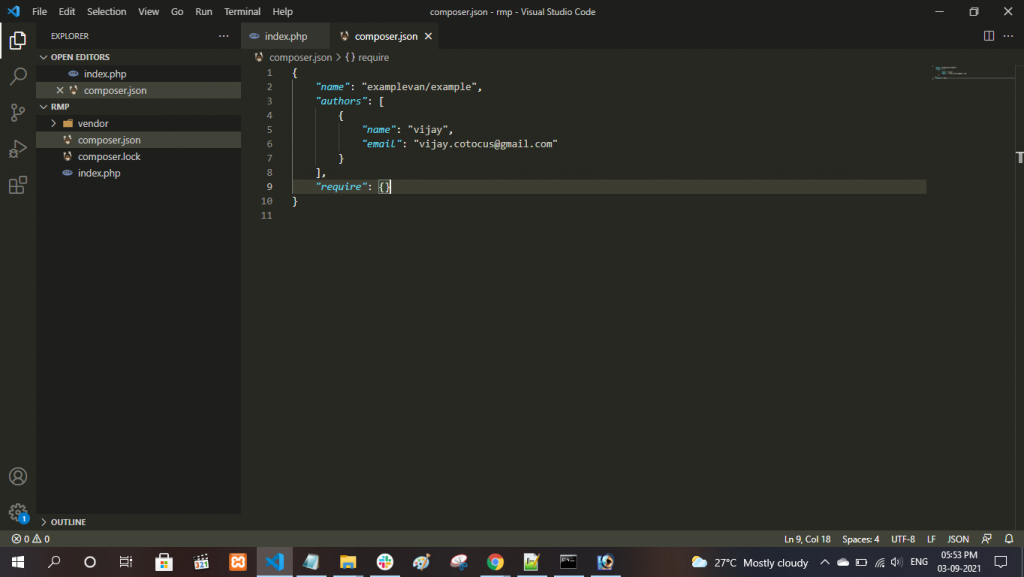
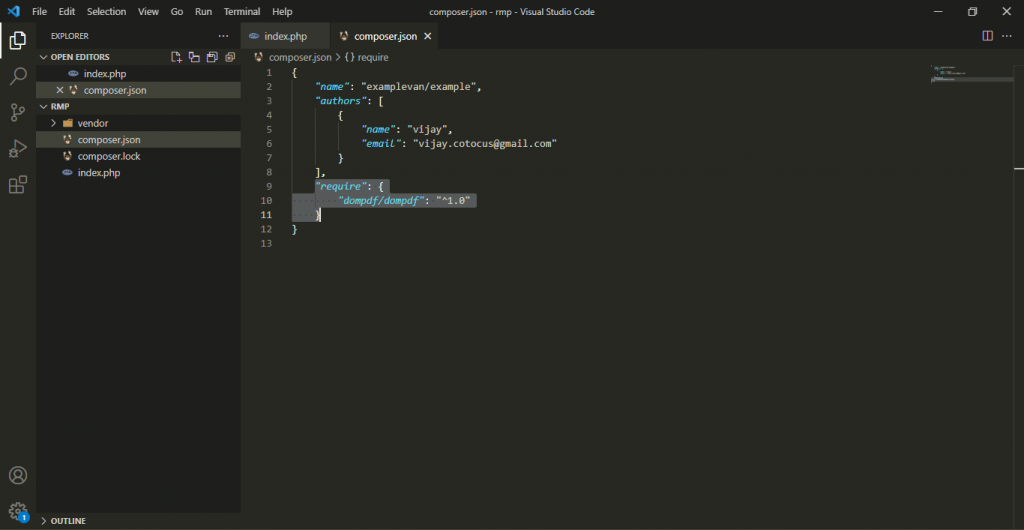
Before running this command, you should check that the composor.json file which you have is empty. That is, our project is not dependent on anyone. But now we have the requirement of this project so we will run this command.

Tagged : / / / /

How to set up a new or existing package?

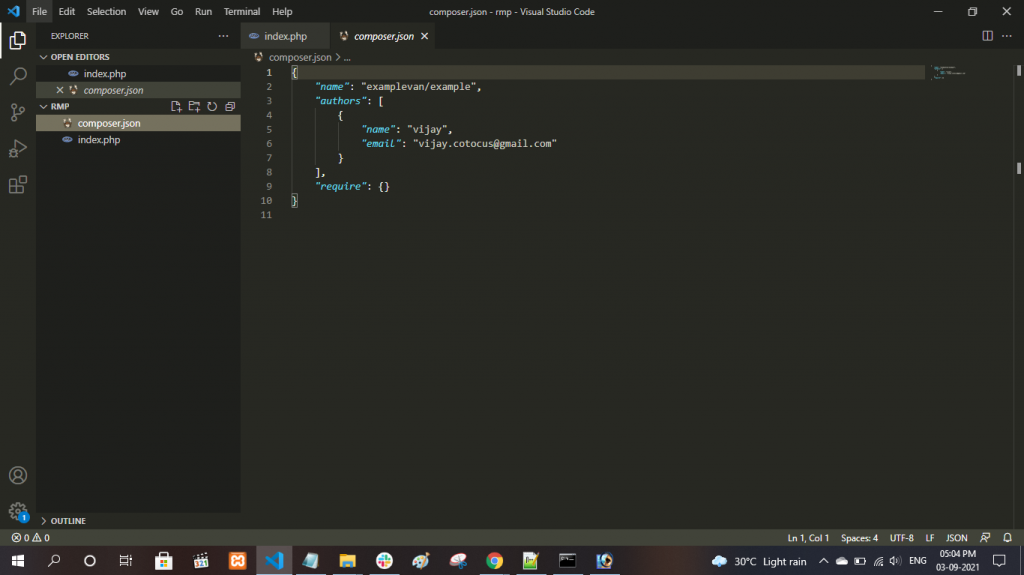
Manually Creating composer.json file

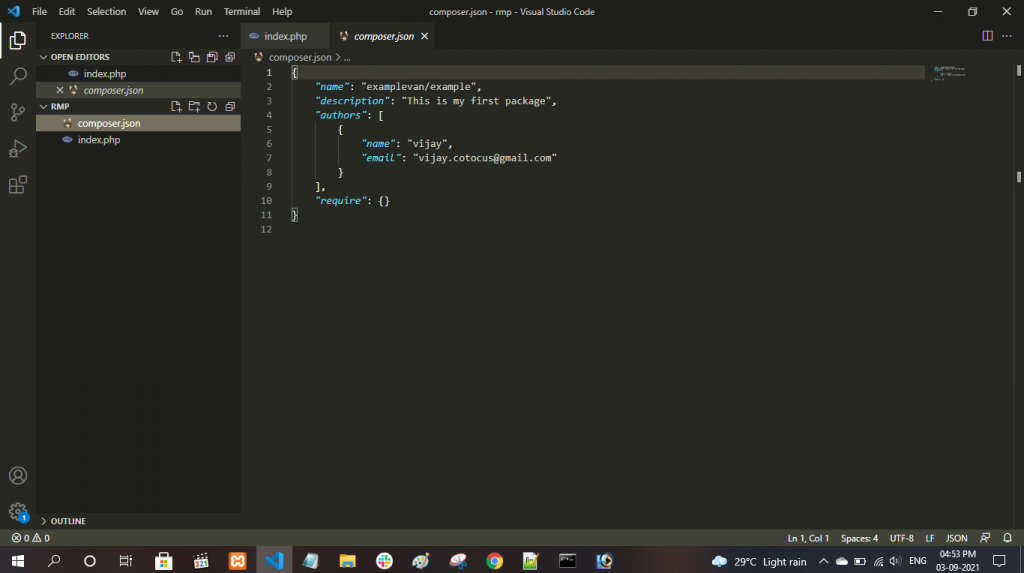
You have to create a composer.joson file and write JSON code yourself with the required properties.

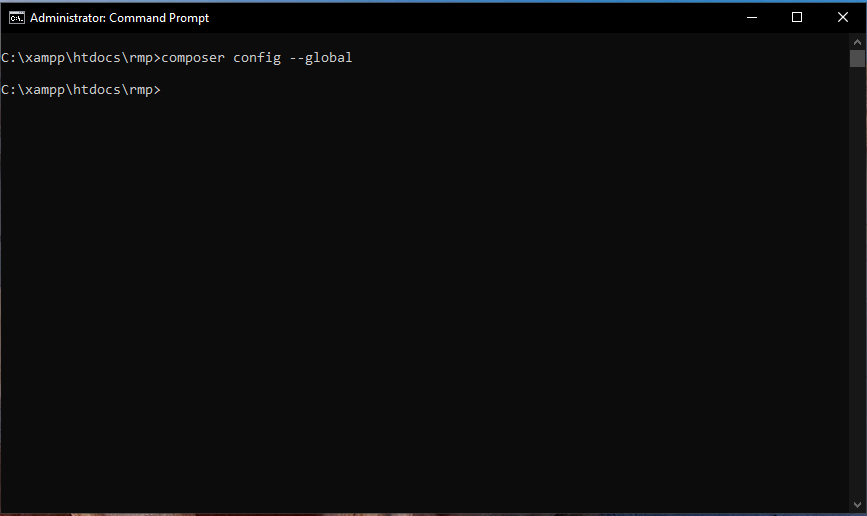
  • composer config –global(-g) – Operate on the global config file located at $COMPOSER_HOME/comfig.json by default. Without this option, this command affects the local composer.json file.
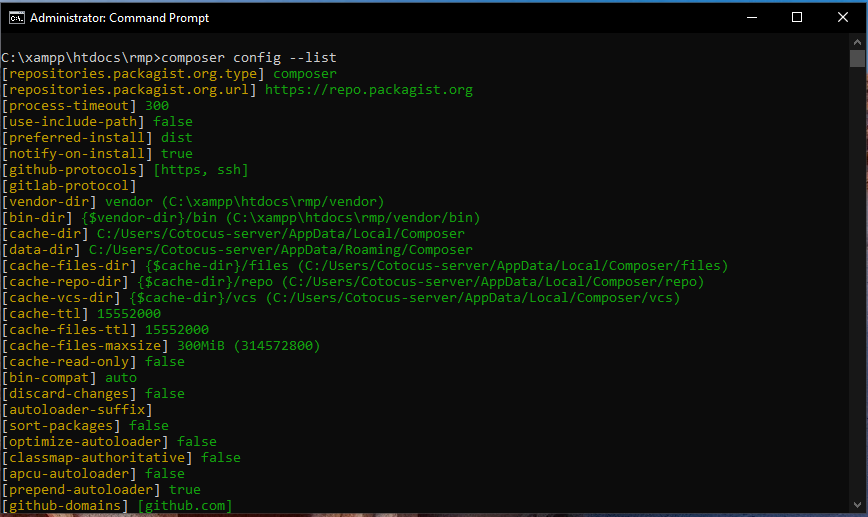
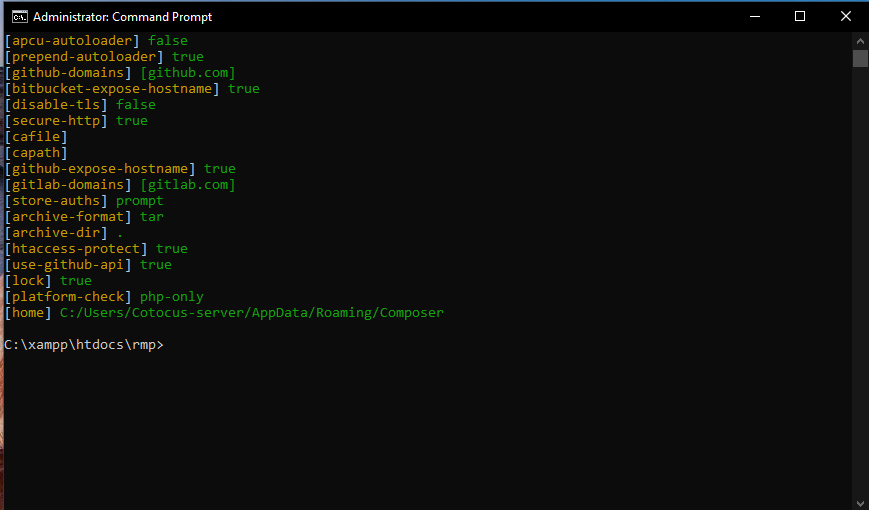
  • composer config –list (-l) __ It shows all the current config variables.
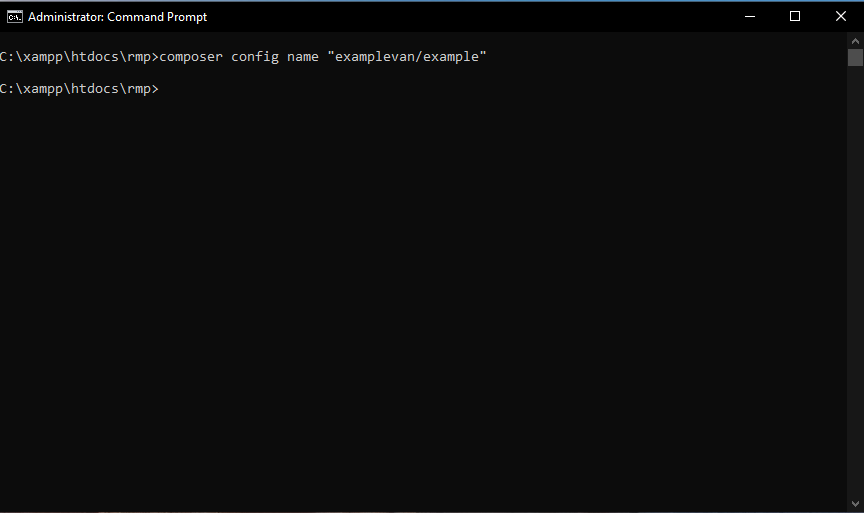
  • composer config setting-key “setting-value” – It sets the config key to the value.
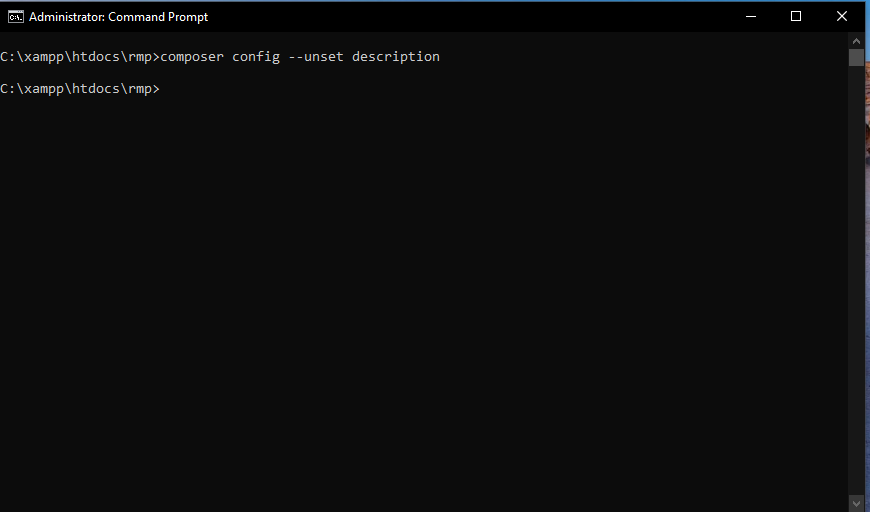
  • composer config –unset – It removes the configuration element named by setting-key.
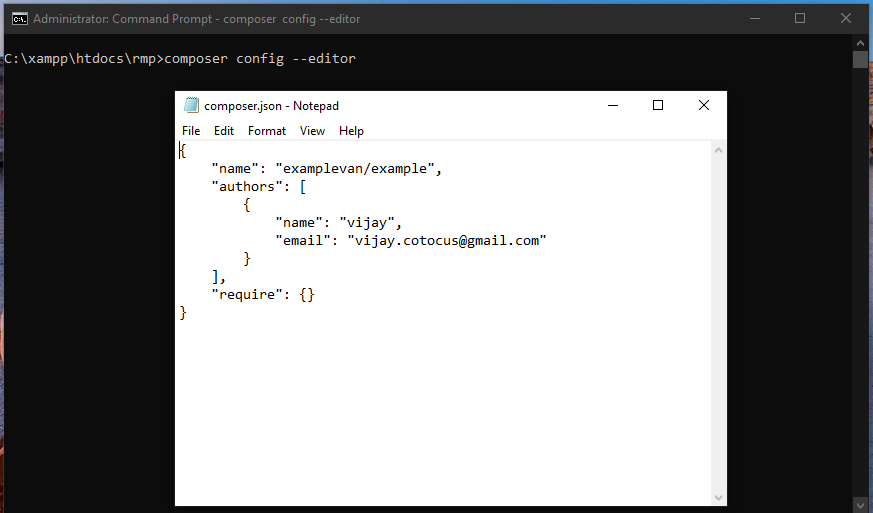
  • composer config –editor (-e) – Opens the config file (composer.json) in an editor. Use the –global flag to edit the congif (config.json).

Keys:

  • name
  • version
  • type
  • description
  • license
  • homepage
  • keywords
Tagged : / / / /

Ansible Adhoc Commands Lab & Excercise – Part 1

Execution Mode – Local

  1. Write a Ansible Adhoc Commands to create a group called “deploy”

  2. Write a Ansible Adhoc Commands to create a user called “deploy-user” which is part of group called “group” and with /bin/bash shell.

  3. Write a Ansble Adhoc commands install package named “httpd” in RHEL/centos.

  4. Write a Ansible Adhoc commands to start and enable the service named “httpd”

  5. Write a Ansible commands to create a file called “index.html” in /var/www/html with some dummy html contents.

  6. Write a Ansible commands to reboot a self machine.

  7. Write a Ansible commands to install a package called “git”, “wget”.

  8. Write a Ansible Adhoc commands to clone git repo. thttps://github.com/scmgalaxy/ansible-role-template

Tagged : / / / /

Delete files and folder using batch commands…

rajeshkumar created the topic: Delete files and folder using batch commands…

del /s /q bin – deletes all files recursively
rmdir bin – delete empty folders..

Regards,
Rajesh Kumar
Twitt me @ twitter.com/RajeshKumarIn

Tagged :

How to Start and Stop Nagios Core | Nagios Tutorial

starting-and-stopping-nagios-core
Starting Nagios Core
Init Script: The easiest way to start the Nagios Core daemon is by using the init script like so:
/etc/rc.d/init.d/nagios start
Manually: You can start the Nagios daemon manually with the -d command line option like so:
/usr/local/nagios/bin/nagios -d /usr/local/nagios/etc/nagios.cfg
Restarting Nagios Core
Restarting/reloading is nececessary when you modify your configuration files and want those changes to take effect.
Init Script: The easiest way to restart the Nagios Core daemon is by using the init script like so:
/etc/rc.d/init.d/nagios reload
Web Interface: You can restart the Nagios Core through the web interface by clicking the “Process Info” navigation link and selecting “Restart the Nagios process”:
Manually: You can restart the Nagios Core process by sending it a SIGHUP signal like so:
kill -HUP <nagios_pid>
Stopping Nagios Core
Init Script: The easiest way to stop the Nagios Core daemon is by using the init script like so:
/etc/rc.d/init.d/nagios stop
Web Interface: You can stop the Nagios Core through the web interface by clicking the “Process Info” navigation link and selecting “Shutdown the Nagios process”:
Manually: You can stop the Nagios Core process by sending it a SIGTERM signal like so:
kill <nagios_pid>
Tagged : / / / / / / / / / / / /

20 pmap Commands Examples in Linux / UNIX | pmap Commands Tutorial

You can find the memory used by a program (process) by looking into /proc directory or using standard command such as ps or top.

However, you must calculate all memory usage by hand i.e. add Shared Memory + mapped file + total virtual memory size of the process + Resident Set Size + non-swapped physical memory used by process. So how do you find the total memory used by a process or program under Linux? Use a tool called pmap. It reports the memory map of a process or processes.
To display process mappings, type
$ pmap pid
$ pmap 3724
If you want to see the exented format
The -x option can be used to provide information about the memory allocation and mapping types per mapping. The amount of resident, non-shared anonymous, and locked memory is shown for each mapping:
$ pmap -x 3526
If you want to see the device format
$ pmap -d 3526
If you do not display some header/footer lines.
$ pmap -q 3526
GENERAL OPTIONS
-x extended Show the extended format.
-d device Show the device format.
-q quiet Do not display some header/footer lines.
-V show version Displays version of program.
Reference
Tagged : / / / / / / / / /

20 mpstat Commands Examples in Linux / UNIX | mpstat Commands Tutorial

If you are using SMP (Multiple CPU) system, use mpstat command to display the utilization of each CPU individually.
mpstat Report processors related statistics which includes Collecting and displays performance statistics for all logical processors in the system.. This display CPU statistics of individual CPU (or) Core.
How to install mpstat?
1. Ensure you are logged in as ‘root’
‘mpstat’ and ‘vmstat’ are apart of the ‘sysstat’ package and should be installed by default
2. Verify installation :
# rpm -qa | grep -i sysstat
3. Installation, if needed :
# rpm -ivh <name>
4. If you have connectivity to RHN or a Satellite Server:
# yum install sysstat
5. If you are using Ubantu:
# apt-get install sysstat

Usage:

1. Using mpstat command without any option, will display the Global Average Activities by All CPUs.
$ mpstat
2. Using mpstat with option ‘-P’ (Indicate Processor Number) and ‘ALL’, will display statistics about all CPUs one by one starting from 0. 0 will the first one.
$ mpstat -P ALL
3. To display the statistics for N number of iterations after n seconds interval with average of each cpu use the following command.
$ mpstat -P ALL 2 5
4. The option ‘I’ will print total number of interrupt statistics about per processor.
$ mpstat -I
5. Get all the above information in one command i.e. equivalent to “-u -I ALL -p ALL”.
$ mpstat -A
Reference
Tagged : / / / / / / / / /

20 iostat Commands Examples in Linux / UNIX | iostat Commands Tutorial

iostat command is a command that used for monitoring system input/output device loading by observing the time the devices are active in relation to their average transfer rates. The iostat create reports that can be used to change system configuration to better balance the input/output between physical disks.
You can use iostat command which report Central Processing Unit (CPU) statistics and input/output statistics for devices and partitions. It can be use to find out your system’s average CPU utilization since the last reboot.
Reports Central Processing Unit (CPU) statistics, asynchronous input/output (AIO) and input/output statistics for the entire system, adapters, TTY devices, disks CD-ROMs, tapes and file systems.
Note:
iostat reports CPU, disk I/O, and NFS statistics.
vmstat reports virtual memory statistics.
mpstat reports processors statictics.
How to install iostat?
1. Ensure you are logged in as ‘root’
‘iostat’ and ‘vmstat’ are apart of the ‘sysstat’ package and should be installed by default
2. Verify installation :
# rpm -qa | grep -i sysstat
3. Installation, if needed :
# rpm -ivh <name>
4. If you have connectivity to RHN or a Satellite Server:
# yum install sysstat
5. If you are using Ubantu:
# apt-get install sysstat
1. iostat – Basic example, Iostat without any argument displays information about the CPU usage, and I/O statistics about all the partitions on the system as shown below.
$ iostat
2. iostat – Display only cpu statistics. iostat option -c, displays only the CPU usage statistics as shown below.
$ iostat -c
3. iostat – Display only disk I/O statistics. iostat option -d, displays only the disk I/O statistics as shown below.
$ iostat -d
4. iostat – Display only network statistics. iostat option -n, displays only the device and NFS statistics as shown below.
$ iostat -n
5. iostat – Display I/O data in MB/second. By default iostat, displays the device I/O statistics in Blocks. To change it to MB, use -m as shown below.

$ iostat -m

6. iostat – Display I/O statistics only for a device. By default iostat displays I/O data for all the disks available in the system. To view statistics for a specific device (For example, /dev/sda), use the option -p as shown below.
$ iostat -p sda
7. iostat – Display timestamp information, By default iostat displays only the current date. To display the current time, use the option -t as shown below.
$ $ iostat -t
8. iostat – Display Extended status, Use option -x, which will displays extended disk I/O statistics information as shown below.
$ iostat -x
9. To display extended information for a specific partition (For example, /dev/sda1), do the following.
$ iostat -x sda1
10. iostat – Execute Every x seconds (for y number of times). To execute iostat every 2 seconds (until you press Ctl-C), do the following.
$ iostat 2
11.To execute every 2 seconds for a total of 3 times, do the following.
$ iostat 2 3
12. iostat – Display LVM statistic (and version)
$ iostat -N
13. To display the version of iostat, use -V. This will really display the version information of sysstat, as iostat is part of sysstat package.
$ iostat -V
Reference
iostat use these files to create reports…
/proc/stat which contains system statistics
/proc/partitions which contains disk statistics (for pre 2.5 kernel that have been patched)
/proc/diskstats contains disks statistics (for post 2.5 kernel)
/sys which contains statistics for block devices (post 2.5 kernel)
Tagged : / / / / / / / / /