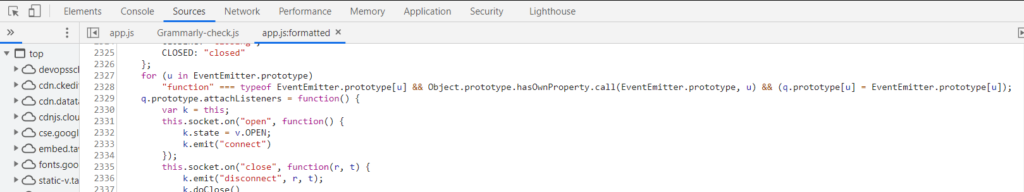
To debug JavaScript in Google Chrome use Developer Tools
To set a breakpoint, simply click on the grey margin where you see line numbers in the Sources tab
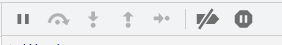
Stepping through the code-
Step Over – F10
Step into – F11
Step out Shift+F11
Continue F8
You can also use the following buttons in the Developer tools to step through the code-
To set a conditional breakpoint, right click on the grey margin and select “add conditional breakpoint”
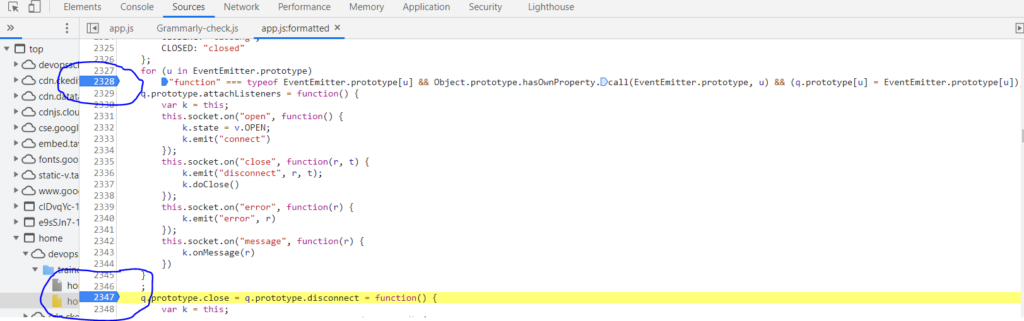
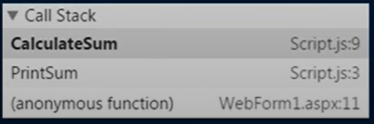
The Call Stack panel displays the complete excetion path and in this path where you want to breakpoint add select any line where auto color blue background that means javascript excution pouse at breakpoint.
If you want to find a individual id then press
Ctrl+shift+I
and go to console tab and select
Ctrl+shift+F
and paste any id and press enter
- AWS Error: Access denied by EC2 Instance Connect - December 4, 2023
- How to get Blackduck Trial version? - December 3, 2023
- PHP ionCube Error: cannot be decoded by this version of the ionCube Loader - December 2, 2023