How Gerrit Works?

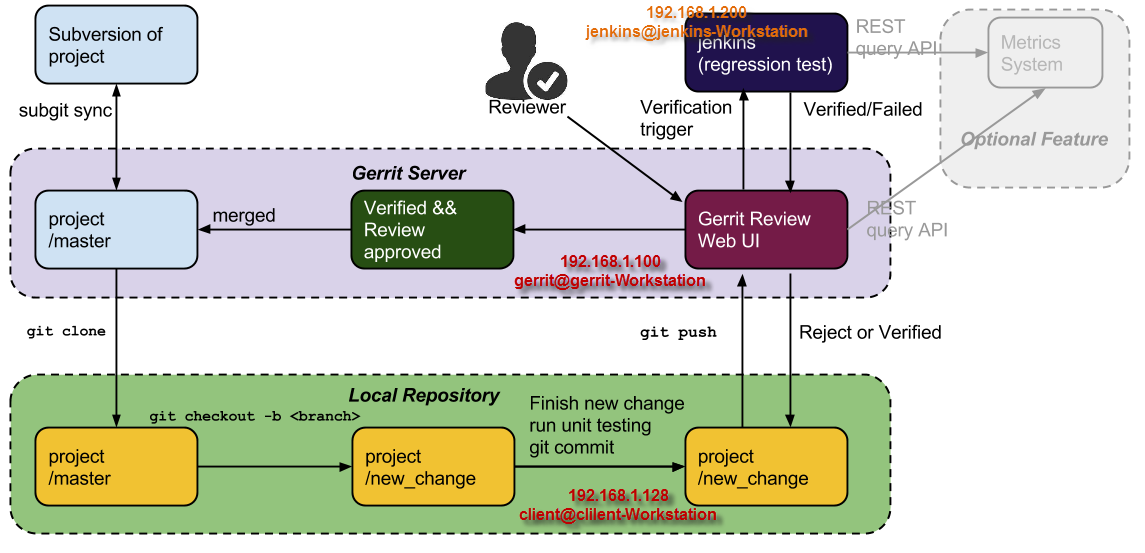
When Gerrit is configured as the central source repository, all code changes are sent to Pending Changes for others to review and discuss. When enough reviewers have approved a code change, you can submit the change to the code base.

In addition to the store of Pending Changes, Gerrit captures notes and comments made about each change. This enables you to review changes at your convenience or when a conversation about a change can’t happen in person. In addition, notes and comments provide a history of each change (what was changed and why and who reviewed the change).

Gerrit project is a workspace consisting of the following elements:

  • Git repository: It is used to store the merged code base and the changes under review that have not being merged yet. Gerrit has the limitation of a single repository per project. There can also be projects without any code repository associated at all (that is, Security-only projects)
  • Changes references under review: Git commit-id (expressed as SHA-1 Hexadecimal alphanumeric string) stored in the Gerrit DB and pointing to the corresponding changes stored in the Git repository. A Gerrit change is a Git commit object uploaded for review and associated to its comments and scores. It is stored in the project’s Git repository but it is not visible/accessible from the normal Git graph of commits, even it does start from a point on the commits graph.
  • Access Control Lists (ACLs): It contains the list of roles defined for the Gerrit project and the associated access permissions to the Git repository branches.
  • Prolog rules: It is the set of rules that govern the Code Review process for the project. 0 Additional metadata: All the extra settings such as description, merge strategy, contributor agreements, and accessory metadata needed in order to manage the project.

We have to make and review a change through these stages in Gerrit:

  1. Making the change.
  2. Creating the review.
  3. Reviewing the change.
  4. Reworking the change.
  5. Verifying the change.
  6. Submitting the change.

Tagged : /

How to setup Kubernetes Dashboard in EKS using NodePort?

How to setup Kubernetes Dashboard in EKS using NodePort?

Step 1: Deploy the Dashboard
# Deploy the Kubernetes dashboard to your cluster:

kubectl apply -f https://raw.githubusercontent.com/kubernetes/dashboard/master/src/deploy/recommended/kubernetes-dashboard.yaml

# Deploy heapster to enable container cluster monitoring and performance analysis on your cluster:

$ kubectl apply -f https://raw.githubusercontent.com/kubernetes/heapster/master/deploy/kube-config/influxdb/heapster.yaml

# Deploy the influxdb backend for heapster to your cluster:

$ kubectl apply -f https://raw.githubusercontent.com/kubernetes/heapster/master/deploy/kube-config/influxdb/influxdb.yaml

# Create the heapster cluster role binding for the dashboard:

$ kubectl apply -f https://raw.githubusercontent.com/kubernetes/heapster/master/deploy/kube-config/rbac/heapster-rbac.yaml

Step 2: Create an eks-admin Service Account and Cluster Role Binding
# Create a file called eks-admin-service-account.yaml with the text below:

vi eks-admin-service-account.yaml
apiVersion: v1
kind: ServiceAccount
metadata:
  name: eks-admin
  namespace: kube-system

$ kubectl apply -f eks-admin-service-account.yaml

vi eks-admin-cluster-role-binding.yaml

apiVersion: rbac.authorization.k8s.io/v1beta1
kind: ClusterRoleBinding
metadata:
  name: eks-admin
roleRef:
  apiGroup: rbac.authorization.k8s.io
  kind: ClusterRole
  name: cluster-admin
subjects:
- kind: ServiceAccount
  name: eks-admin
  namespace: kube-system

$ kubectl apply -f eks-admin-cluster-role-binding.yaml

Step 3: Retrieve an authentication token 
Retrieve an authentication token for the eks-admin service account. Copy the <authentication_token> value from the output. You use this token to connect to the dashboard.

kubectl -n kube-system describe secret $(kubectl -n kube-system get secret | grep eks-admin | awk '{print $1}')

Step 4: Connect to the Dashboard Via Node Port
Retrieve an authentication token for the eks-admin service account. Copy the <authentication_token> value from the output. You use this token to connect to the dashboard.

$ kubectl -n kube-system describe secret $(kubectl -n kube-system get secret | grep eks-admin | awk '{print $1}')
$ kubectl get pods --all-namespaces
$ kubectl get pods --namespace=kube-system
$ kubectl get svc --all-namespaces

$ kubectl edit svc/kubernetes-dashboard --namespace=kube-system
or
$ kubectl -n kube-system edit service kubernetes-dashboard
Just change "type: NodePort" only

# Please edit the object below. Lines beginning with a '#' will be ignored,
# and an empty file will abort the edit. If an error occurs while saving this file will be
# reopened with the relevant failures.
#
apiVersion: v1
kind: Service
metadata:
  creationTimestamp: 2018-07-27T10:22:50Z
  labels:
    k8s-app: kubernetes-dashboard
  name: kubernetes-dashboard
  namespace: kube-system
  resourceVersion: "3288196"
  selfLink: /api/v1/namespaces/kube-system/services/kubernetes-dashboard
  uid: 03f2f747-9187-11e8-9432-02b761c0deac
spec:
  clusterIP: 10.100.194.75
  externalTrafficPolicy: Cluster
  ports:
  - nodePort: 30530
    port: 443
    protocol: TCP
    targetPort: 8443
  selector:
    k8s-app: kubernetes-dashboard
  sessionAffinity: None
  type: NodePort
status:
  loadBalancer: {}

$ kubectl describe pods kubernetes-dashboard-7d5dcdb6d9-mt9b9 --namespace=kube-system 
#Find which node is running and get a Port of SVC

$ kubectl get svc --all-namespaces
$ kubectl get pods --all-namespaces
$ kubectl describe pods kubernetes-dashboard-7d5dcdb6d9-h9dcb --namespace=kube-system

Step 5: Connect to the Dashboard Via ClustorIP and Proxy
http://localhost:8001/api/v1/namespaces/kube-system/services/https:kubernetes-dashboard:/proxy/

https://10.16.39.28:30178/


IMPORTANT – Kubernetes Dashboard should be HTTPS


Tagged : / / / /

What is Annotations in Kubernetes?

What is Annotations in Kubernetes?

There are two way using you can attach metadata to Kubernetes objects.

  1. labels
  2. annotations

Kubernetes annotations is used to attach arbitrary non-identifying metadata to objects. Clients such as tools and libraries can retrieve this metadata.

In contrast, annotations are not used to identify and select objects. The metadata in an annotation can be small or large, structured or unstructured, and can include characters not permitted by labels.

Annotations, like labels, are key/value maps:

apiVersion: extensions/v1beta1

kind: Deployment

metadata:

  annotations:

    kompose.cmd: ./kompose convert

    kompose.version: “”

FORMAT

"metadata": {</p>
<p class="p1"><span class="Apple-converted-space">  </span>"annotations": {</p>
<p class="p1"><span class="Apple-converted-space">    </span>"key1" : "value1",</p>
<p class="p1"><span class="Apple-converted-space">    </span>"key2" : "value2"</p>
<p class="p1"><span class="Apple-converted-space">  </span>}</p>
<p class="p1">}</p>

Here are some examples of information that could be recorded in annotations:

  1. Build, release, or image information like timestamps, release IDs, git branch, PR numbers, image hashes, and registry address.
  2. Pointers to logging, monitoring, analytics, or audit repositories.

More

https://kubernetes.io/docs/concepts/overview/working-with-objects/annotations/

Tagged : / /

What is EKS and How EKS can help you?

In simple line, Amazon EKS is generally available, bringing fully-managed Kubernetes to AWS.

Amazon launched Amazon EKS in November at its re:Invent 2017 conference. Till the time this article is written, Amazon EKS is available in the US East (N. Virginia) and US West (Oregon) Regions only.

The cost of running EKS is $0.20 per hour for the EKS Control Plane, apart from EC2, EBS, and Load Balancing prices for resources that run in your account.

How does Amazon EKS work?

Amazon EKS works by provisioning (starting) and managing the Kubernetes control plane for you. At a high level, Kubernetes consists of two major components – a cluster of ‘worker nodes’ that run your containers and the control plane that manages when and where containers are started on your cluster and monitors their status.

Without Amazon EKS, you have to run both the Kubernetes control plane and the cluster of worker nodes yourself. With Amazon EKS, you provision your cluster of worker nodes using the provided Amazon Machine Image (AMI) and AWS CloudFormation script and AWS handles provisioning, scaling, and managing the Kubernetes control plane in a highly available and secure configuration. This removes a significant operational burden for running Kubernetes and allows you to focus on building your application instead of managing AWS infrastructure.

Major Features of Amazon Elastic Container Service for Kubernetes (EKS)
Amazon Elastic Container Service for Kubernetes (EKS) is a managed Kubernetes service that makes it easy for you to run Kubernetes on AWS without needing to install, operate, and maintain your own Kubernetes control plane.

  1. Availability and Scalability of Nodes – Amazon EKS automatically manages the availability and scalability of the Kubernetes control plane nodes that are responsible for
    1. Starting and stopping containers,
    2. Scheduling containers on virtual machines,
    3. Storing cluster data, and other tasks.
  2. Health check of Nodes – Amazon EKS Automatically detects and replaces unhealthy control plane nodes for each cluster.
  3. Amazon EKS Integration – Great Integration with AWS networking and security services, such as Application Load Balancers for load distribution, IAM for role based access control, and VPC for pod networking.
  4. Managed Kubernetes Control Plane – Amazon EKS provides a scalable and highly-available control plane that runs across multiple AWS availability zones.
  5. Kubernetes Masters in three Availability Zones – Amazon EKS runs the Kubernetes control plane across three Availability Zones in order to ensure high availability, and it automatically detects and replaces unhealthy masters.
  6. Amazon EKS with IAM Authentication – Amazon EKS integrates Kubernetes RBAC (the native role based access control system for Kubernetes) with IAM authentication through a collaboration with Heptio. You can assign RBAC roles directly to each IAM entity allowing you to granularly control access permissions to your Kubernetes masters.
  7. Amazon EKS with VPC Support
    Your EKS clusters run in an Amazon VPC, allowing you to use your own VPC security groups and network ACLs. No compute resources are shared with other customers. This provides you a high level of isolation and helps you use Amazon EKS to build highly secure and reliable applications.
  8. Container Interface – EKS uses the Amazon VPC CNI to allow Kubernetes pods to receive IP addresses from the VPC means The Container Network Interface for Kubernetes uses Elastic Network Interfaces to provide secondary IP addresses for Kubernetes Pods.
  9. Amazon EKS Logging
    Amazon EKS is integrated with AWS CloudTrail to provide visibility and audit history of your cluster and user activity. You can use CloudTrail to view API calls to the Amazon EKS API.
  10. Amazon EKS with EBS – Kubernetes PersistentVolumes (used for cluster storage) are implemented as Amazon Elastic Block Store (EBS) volumes.
  11. Amazon EKS with Route 53 – The External DNS project allows services in Kubernetes clusters to be accessed via Route 53 DNS records. This simplifies service discovery and supports load balancing.
  12. Amazon EKS Support – Amazon EKS runs up-to-date versions of the open-source Kubernetes software, so you can use all the existing plugins and tooling from the Kubernetes community.

Reference
EKS Getting Started Guide
EKS Publication
EKS FAQ

Tagged : / / / / / /