Introduction
Data Observability Tools are platforms that monitor, track, and alert on the state of data throughout its entire lifecycle. Unlike traditional data quality tools that often rely on manual, static rules (e.g., “this column should not be null”), data observability uses a more holistic approach. It focuses on the “Five Pillars of Data Observability”: Freshness (is the data up to date?), Distribution (is the data within expected ranges?), Volume (did we get the expected amount of data?), Schema (has the structure changed?), and Lineage (where did this data come from and where is it going?).
Why It Matters
Data observability is the “insurance policy” for the modern data stack. It helps data engineers move from being reactive—fixing problems only after a business user complains about a broken dashboard—to being proactive. By using machine learning to establish a baseline of “normal” data behavior, these tools can detect anomalies that human operators might never think to check.
Key Real-World Use Cases
- Reducing Data Downtime: Identifying a failed pipeline execution before it affects downstream analytics.
- Incident Root Cause Analysis: Using lineage to quickly pinpoint which upstream source caused a specific data error.
- Cost Management: Monitoring warehouse usage and detecting runaway queries that spike cloud bills.
- SLA Management: Ensuring that data is delivered to business stakeholders within agreed-upon timeframes.
What to Look For
When evaluating tools, focus on automated discovery (can it learn your data without manual configuration?), integration depth (does it support your specific warehouse and orchestrator?), ease of alerting, and security certifications.
Best for: Data engineers, analytics engineers, and DevOps teams in mid-market to enterprise companies. It is essential for organizations where data is a core product or where automated decisions (AI/ML) drive significant revenue.
Not ideal for: Small startups with very simple, static datasets or teams where data is strictly utilized for ad-hoc, non-critical internal reporting. In these cases, simple SQL validation scripts are often more cost-effective.
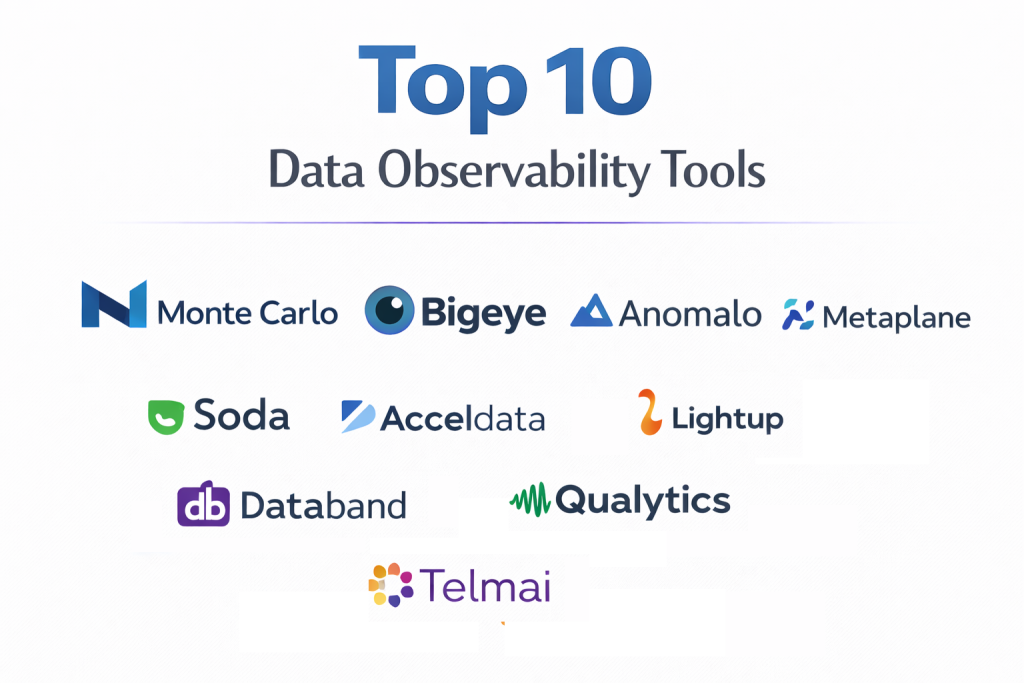
Top 10 Data Observability Tools
1 — Monte Carlo
Monte Carlo is widely recognized as the pioneer of the data observability category. It offers a fully automated, “no-code” approach to monitoring that is designed to provide immediate visibility across the entire data stack.
- Key features:
- Automated Data Profiling: Uses ML to automatically learn the patterns of your data without manual threshold setting.
- End-to-End Lineage: Automatically maps how data flows from the source to the BI layer (e.g., Tableau, Looker).
- Incident Management: Provides a centralized workspace for teams to triage, investigate, and resolve data issues.
- Field-Level Lineage: Allows users to see the impact of changes down to the specific column level.
- Data Health Dashboards: Executive-level views of data reliability and “uptime” metrics.
- Pros:
- Incredibly fast “time-to-value” due to the automated discovery of anomalies.
- Strongest lineage capabilities in the market, bridging the gap between engineering and BI.
- Cons:
- Premium pricing can be a barrier for smaller organizations or those with massive table counts.
- Focuses primarily on cloud-native stacks; less support for legacy on-premise systems.
- Security & compliance: SOC 2 Type II, HIPAA, GDPR, and SSO integration.
- Support & community: High-touch enterprise support, dedicated customer success managers, and an active Slack community for practitioners.
2 — Bigeye
Bigeye focuses on “Data Reliability” with a platform that emphasizes deep metric tracking and automated thresholding for teams that need high-precision monitoring.
- Key features:
- Autometrics: Automatically suggests and tracks thousands of metrics like null rates, uniqueness, and distribution.
- SLA Tracking: Specifically designed to monitor “Service Level Agreements” for data delivery.
- Delta Monitoring: Compares data between source and destination to ensure nothing was lost in transit.
- Root Cause Analysis: Suggests potential causes for an anomaly by looking at historical trends.
- API-First Architecture: Allows engineers to integrate Bigeye directly into their existing CI/CD workflows.
- Pros:
- Excellent for high-precision data where slight distribution shifts matter (e.g., Fintech).
- Very user-friendly interface that makes it easy for non-engineers to set up custom monitors.
- Cons:
- Can lead to “alert fatigue” if monitors are not carefully tuned.
- Lineage features are not as visually comprehensive as some competitors.
- Security & compliance: SOC 2 Type II, GDPR, and encryption at rest/transit.
- Support & community: Robust documentation and responsive technical support; growing community of reliability-focused engineers.
3 — Anomalo
Anomalo stands out for its deep focus on data quality using unsupervised machine learning. It is built to detect “silent” errors—cases where a pipeline finishes successfully, but the data inside is nonsensical.
- Key features:
- Unsupervised Anomaly Detection: Learns complex data distributions without requiring manual rules.
- Deep Data Profiling: Visualizes data distributions, correlations, and outliers automatically.
- Root Cause Explanation: Uses ML to explain why a record is considered an anomaly (e.g., “this ZIP code doesn’t match the city”).
- No-Code UI: Allows business users to define what “good data” looks like via a simple interface.
- Validation Rules: Combines ML-based monitoring with traditional SQL-based constraint checking.
- Pros:
- Exceptional at finding complex, logic-based errors that simple volume or freshness checks would miss.
- Minimal manual maintenance; the AI adjusts as the data evolves.
- Cons:
- Best used with modern cloud warehouses; integration with older legacy systems is limited.
- Pricing is often based on the number of tables monitored, which requires careful selection.
- Security & compliance: SOC 2 Type II and GDPR compliant.
- Support & community: Strong engineering-led support and detailed technical documentation.
4 — Metaplane
Metaplane is often called “the data observability tool for the modern data stack.” It focuses on ease of use, speed of setup, and deep integration with tools like Snowflake, dbt, and Slack.
- Key features:
- 5-Minute Setup: Designed to be connected and running in minutes, not days.
- Slack-First Alerting: Highly optimized for team collaboration within Slack channels.
- Downstream Impact: Identifies which Looker dashboards or reports will be affected by a data failure.
- Schema Drift Detection: Instantly alerts when a developer changes a table structure upstream.
- Usage Analytics: Helps identify “stale” data that is costing money but not being used.
- Pros:
- Best-in-class user experience; it is the most intuitive tool on the list.
- Very transparent and accessible pricing for mid-market companies.
- Cons:
- Lacks some of the heavyweight “governance” features found in enterprise-grade suites.
- Smaller library of connectors for non-cloud-native databases.
- Security & compliance: SOC 2 Type II and GDPR.
- Support & community: Very active community, excellent “getting started” guides, and highly responsive support.
5 — Soda (Soda Cloud)
Soda provides an open-source framework (Soda Core) combined with a commercial cloud platform (Soda Cloud) to facilitate “Data Agreements” between producers and consumers.
- Key features:
- SodaCL: A human-readable, YAML-based language for defining data quality tests.
- Self-Serve Monitoring: Allows analysts to create their own monitoring without writing complex SQL.
- Integration with dbt: Can ingest dbt test results to provide a unified view of data health.
- Incident Workflows: Native integration with Jira and ServiceNow for enterprise ticket management.
- Data Profiling Dashboards: Visualizations that show how data quality is trending over time.
- Pros:
- The open-source Core version allows engineers to start testing for free.
- SodaCL is incredibly powerful and easy for non-engineers to understand.
- Cons:
- The best visualization and collaboration features are locked behind the paid Cloud tier.
- Requires some initial setup of YAML files, which may be a hurdle for less technical teams.
- Security & compliance: SOC 2 Type II and GDPR compliant.
- Support & community: Massive open-source community, active Slack, and comprehensive “Soda University” training.
6 — Acceldata
Acceldata is an enterprise-grade platform that goes beyond data quality to include “Compute Observability.” It is designed for large-scale operations running Spark, Hadoop, or Snowflake.
- Key features:
- Multi-Layer Observability: Monitors data quality, pipeline performance, and compute costs in one tool.
- Spend Intelligence: Deep analysis of Snowflake or Databricks spend to identify inefficiencies.
- Hadoop/Spark Monitoring: One of the few modern tools with robust support for big data legacy stacks.
- Automated Data Reconciliation: Ensures data matches between source, staging, and production.
- Policy Engine: Allows enterprises to define and enforce global data standards.
- Pros:
- The only tool that effectively combines data reliability with cost and performance optimization.
- Highly scalable for petabyte-scale data environments.
- Cons:
- The interface can be complex due to the sheer volume of features.
- Implementation takes longer than the “plug-and-play” SaaS competitors.
- Security & compliance: ISO 27001, SOC 2, HIPAA, and GDPR.
- Support & community: Enterprise-grade support with dedicated technical account managers.
7 — Databand (by IBM)
Databand (acquired by IBM) focuses on “Pipeline Observability.” It is built to provide visibility into the orchestrator layer (like Airflow) and the execution layer (like Spark).
- Key features:
- Orchestration Monitoring: Deep integration with Apache Airflow to track task failures and latencies.
- Data Impact Analysis: Links pipeline failures to the specific datasets they produce.
- Metadata Harvesting: Automatically captures metadata from Spark jobs and SQL executions.
- SLA Tracking: Monitors and alerts on “long-running” jobs before they miss their deadlines.
- Integration with IBM Ecosystem: Seamlessly works with IBM Knowledge Catalog and Cloud Pak for Data.
- Pros:
- The best choice for teams where “pipeline health” is just as important as “data health.”
- Strongest Airflow integration in the market.
- Cons:
- Focuses more on the “plumbing” than on deep data distribution analysis.
- The UI can feel more like an APM (Application Performance Monitoring) tool than a data tool.
- Security & compliance: SOC 2 Type II, GDPR, and ISO 27001.
- Support & community: Backed by IBM’s global support network and extensive documentation.
8 — Lightup
Lightup offers a “no-code” data quality and observability platform that specializes in high-speed, real-time data streams and massive cloud warehouses.
- Key features:
- Push-Down Execution: Runs monitors directly inside the warehouse to avoid data egress costs.
- Time-Series Analysis: Exceptional at monitoring data that arrives in a stream (e.g., IoT data).
- Automated Data Mapping: Learns the relationships between tables to provide basic lineage.
- No-Code Query Builder: Allows business stewards to build complex data checks visually.
- Scalable Monitoring: Built to handle tables with billions of rows without performance hits.
- Pros:
- Very cost-effective for large-scale monitoring because data doesn’t leave the warehouse.
- Strong focus on “Time-Series” data, which is often a blind spot for other tools.
- Cons:
- Lineage depth is not as advanced as Monte Carlo.
- Smaller community footprint compared to the market leaders.
- Security & compliance: SOC 2 Type II and GDPR.
- Support & community: Responsive support and specialized onboarding for enterprise customers.
9 — Telmai
Telmai is an AI-driven data observability platform that is designed to work across the entire architecture—from the lake to the warehouse to the BI tool.
- Key features:
- Schema Evolution Tracking: Detects even subtle changes in JSON or semi-structured data.
- Data Value Monitoring: Tracks the actual values inside records to find logical inconsistencies.
- Hybrid Support: Works with both modern cloud warehouses and on-premise data lakes.
- Anomaly Explanation: Provides clear, plain-language reasons why an alert was triggered.
- Privacy Scanning: Can identify potentially sensitive data as part of the observability process.
- Pros:
- Excellent at handling “unstructured” and “semi-structured” data (like nested JSON).
- High level of automation in the anomaly detection engine.
- Cons:
- Newer entrant in the market; fewer integrations with niche BI tools.
- The user interface is functional but lacks some of the polish of Metaplane or Atlan.
- Security & compliance: SOC 2 Type II and GDPR compliant.
- Support & community: Direct access to engineering support and a growing knowledge base.
10 — Qualytics
Qualytics focuses on “Active Data Quality,” aiming to not just observe but also provide the framework to prevent bad data from reaching production.
- Key features:
- Data Enrichment: Automatically suggests how to improve data as it is being monitored.
- Continuous Profiling: Profiles data in real-time as it flows through the system.
- Automated Remediation: Can suggest “fixes” for common data quality issues.
- Enterprise Governance: Includes features for data stewardship and policy enforcement.
- Collaborative Workflows: Built-in tools for data and business teams to resolve issues together.
- Pros:
- Goes beyond “observability” into proactive “improvement” of data quality.
- Very strong focus on the governance aspects of data management.
- Cons:
- Can be more complex to set up due to the “active” remediation features.
- Lacks the deep pipeline/orchestrator visibility of Databand.
- Security & compliance: SOC 2 Type II, HIPAA, and GDPR.
- Support & community: Personalized onboarding and high-touch enterprise support.
Comparison Table
| Tool Name | Best For | Platform(s) Supported | Standout Feature | Rating (Gartner) |
| Monte Carlo | Large Enterprise | Snowflake, BigQuery, Databricks | End-to-End Lineage | 4.7 / 5.0 |
| Bigeye | Precision Metrics | Multi-Cloud, Hybrid | SLA Tracking | 4.6 / 5.0 |
| Anomalo | Deep Quality / ML | Cloud-Native | Root Cause Explanations | N/A |
| Metaplane | SMB / Mid-Market | Snowflake, BigQuery | 5-Minute Setup | N/A |
| Soda | Data Agreements | Cloud, Hybrid, On-Prem | SodaCL (Language) | 4.5 / 5.0 |
| Acceldata | Compute & Data | Snowflake, Databricks, Hadoop | Spend Intelligence | 4.4 / 5.0 |
| Databand | Pipeline Health | Airflow, Spark, Cloud | Orchestrator Tracking | 4.3 / 5.0 |
| Lightup | High-Volume Streams | Cloud Warehouses | Push-Down Execution | N/A |
| Telmai | Semi-Structured Data | Cloud & Hybrid | JSON Schema Tracking | N/A |
| Qualytics | Active Governance | Cloud-Native | Automated Remediation | N/A |
Evaluation & Scoring of Data Observability Tools
The following table breaks down the weighted scoring rubric used to evaluate these tools, representing a balance between technical depth and business practicality.
| Category | Weight | Evaluation Criteria |
| Core Features | 25% | Freshness, volume, distribution, schema, and lineage monitoring. |
| Ease of Use | 15% | Speed of setup, UI/UX, and accessibility for non-engineers. |
| Integrations | 15% | Depth of support for warehouses, orchestrators, and BI tools. |
| Security & Comp. | 10% | SOC 2/HIPAA/GDPR status and data encryption practices. |
| Performance | 10% | Impact on warehouse performance and scalability with big data. |
| Support & Comm. | 10% | Documentation quality, community size, and support responsiveness. |
| Price / Value | 15% | Total cost of ownership vs. the ROI of reduced data downtime. |
Which Data Observability Tool Is Right for You?
Solo Users vs SMB vs Mid-Market vs Enterprise
- Solo Users/Small Teams: Start with Soda (Core) or Metaplane. They offer low-to-no-cost entry points and take minutes to set up, which is vital when you don’t have a dedicated data engineering team.
- Mid-Market: Metaplane and Bigeye are the “sweet spot.” They provide enterprise-grade observability without the administrative overhead of a massive platform.
- Enterprise: Monte Carlo, Acceldata, and Anomalo are the clear winners. They handle the complexity of global data stacks and provide the “governance” features that large corporations require.
Budget-Conscious vs Premium Solutions
- Budget-Conscious: Soda (Open Source) is the gold standard for those who want to build their own framework. Metaplane offers the best SaaS value.
- Premium: Monte Carlo and Anomalo are the high-end choices. You are paying for the most advanced ML and the deepest lineage integrations in the world.
Feature Depth vs Ease of Use
If your priority is Ease of Use, choose Metaplane. If your priority is Feature Depth (e.g., monitoring Spark jobs, cost optimization, or deep ML analysis), Acceldata or Anomalo are the better bets.
Integration and Scalability Needs
If you have data in legacy on-premise systems like Hadoop, your choices are narrowed to Acceldata or IBM Databand. If you are 100% cloud-native on Snowflake, any tool on this list will serve you well.
Frequently Asked Questions (FAQs)
1. How is Observability different from Data Quality testing?
Data Quality testing is usually “unit testing” for data (e.g., checking for nulls). Observability is “monitoring” for data (e.g., noticing that the distribution of values today is different from the last 30 days).
2. Does Data Observability move my data to their servers?
Most modern tools (like Monte Carlo or Metaplane) use “metadata-only” architectures. They only look at the stats of your data, meaning your actual sensitive customer data stays within your secure warehouse.
3. Do I need a Data Observability tool if I use dbt?
dbt is great for “testing” during transformation. However, a data observability tool monitors your data after it’s been loaded and while it’s sitting in the warehouse, catching issues dbt might miss.
4. How much do these tools typically cost?
Pricing varies wildly. Small teams can start for $5,000–$10,000 a year, while large enterprise deployments can easily exceed $100,000 depending on the volume of tables monitored.
5. Can these tools prevent data errors?
They can’t stop a source system from sending bad data, but they can “prevent” the business from making bad decisions by alerting you immediately so you can pause downstream reports.
6. What is “Data Lineage”?
Lineage is a visual map showing where data came from and where it is going. It is the most important feature for “root cause analysis” when something breaks.
7. How long does implementation take?
Cloud-native tools like Metaplane take 5–30 minutes to connect. Large enterprise platforms like Acceldata or Monte Carlo may take 2–4 weeks for a full rollout across all departments.
8. Can I build my own observability tool?
Yes, using open-source tools like Great Expectations or Soda Core. However, you will have to spend significant engineering time building the dashboards and alerting systems.
9. Do these tools help with GDPR/HIPAA?
Yes. By identifying where data lives and how it flows (lineage), they make it much easier to audit your data for privacy compliance.
10. What is “Schema Drift”?
Schema drift is when the structure of your data changes unexpectedly—for example, a column is renamed or a data type is changed. Observability tools catch this instantly.
Conclusion
The “Wild West” of unmonitored data pipelines is quickly coming to an end. As data becomes the lifeblood of modern business, the ability to observe and trust that data is no longer a luxury—it is a baseline requirement.
Choosing the right Data Observability Tool is about finding the balance between automation and control. If you are a fast-moving cloud team, Metaplane or Monte Carlo will give you the visibility you need with almost zero effort. If you are a massive enterprise with legacy debt, Acceldata or Databand will provide the “deep-tissue” monitoring required for complex systems.
Ultimately, the best tool is the one that your engineers will actually use. Start small, pick your most critical tables, and build a culture of data reliability that will pay dividends for years to come.

- Top 10 Email Deliverability Tools: Features, Pros, Cons & Comparison - September 6, 2026
- Top 10 Pharmacovigilance Software: Features, Pros, Cons & Comparison - September 6, 2026
- Top 10 Manufacturing Execution Systems (MES) - July 30, 2026