Introduction
Workspace Analytics Tools are software platforms that collect, analyze, and visualize data about how physical office spaces and assets are used. They move beyond guesswork, using sensors (like occupancy counters, desk sensors, and environmental monitors), badge swipe data, and integrations with existing systems (like calendars and room booking software) to provide a data-driven view of workplace utilization.
This data is critically important for making strategic, evidence-based decisions about your most significant operational cost: real estate. In an era of hybrid work, these tools help organizations right-size their office footprint, optimize space design for actual employee needs, enhance employee experience by ensuring resources are available, and improve operational efficiency in cleaning, maintenance, and energy use. Without this data, companies risk wasting millions on underutilized real estate or creating frustrating workplace experiences that hinder collaboration and productivity.
Key real-world use cases include identifying which floors, departments, or building types are consistently underused to support consolidation or subleasing decisions, redesigning office layouts based on data showing high demand for collaboration spaces vs. focus rooms, dynamically managing “hot desk” or “hoteling” systems to match daily demand, optimizing cleaning schedules based on actual usage rather than fixed timetables, and monitoring environmental conditions (like air quality, temperature, and noise) to ensure a healthy, productive work environment.
When choosing a workspace analytics tool, key evaluation criteria include the accuracy and type of data collection (sensor-based vs. network-based), depth and customizability of reporting and dashboards, ease of integration with existing workplace tech (IoT, IWMS, HRIS), quality of data visualization and insights, privacy protections for employee data, and the vendor’s ability to provide strategic consultancy to turn data into actionable plans.
Best for: Corporate real estate (CRE) and workplace managers, facilities directors, HR leaders focused on employee experience, and operations executives in companies with a dedicated physical office footprint. They are essential for mid-to-large-sized enterprises across finance, technology, professional services, and any industry managing multiple offices or complex hybrid work policies.
Not ideal for: Fully remote companies with no physical space to analyze. Very small businesses (e.g., under 20 people in a single open office) where space use is visually obvious and informal. Organizations with a strict, non-negotiable fixed-desk model and no plans to change their footprint or layout may find the ROI limited.
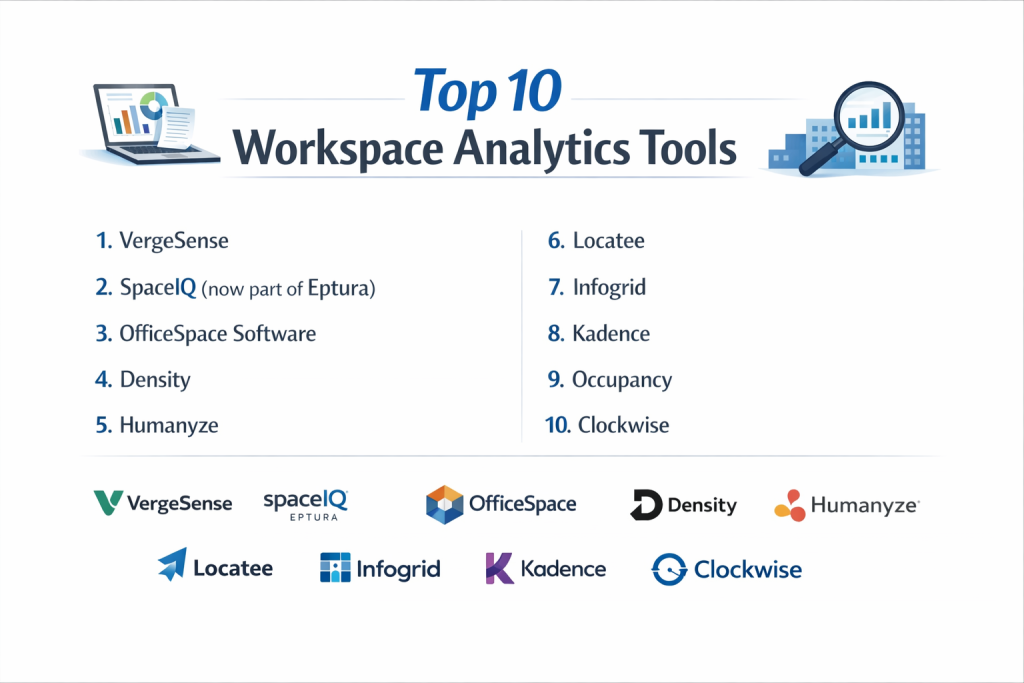
Top 10 Workspace Analytics Tools
1 — VergeSense
VergeSense is a leading AI-powered sensor platform that provides detailed, anonymized occupancy and utilization analytics. It’s known for its high-accuracy, privacy-centric sensors and sophisticated analytics that go beyond simple headcounts to understand how space is used.
- Key features:
- AI-powered overhead sensors that detect occupancy and classify activity (e.g., focused work, collaboration, socialization) while preserving anonymity.
- Rich space utilization analytics showing peak usage, dwell times, and space type effectiveness.
- Benchmarking data against industry peers for comparative insights.
- Space planning simulations to model the impact of layout changes before implementation.
- Integrations with major workplace apps like Envoy, OfficeSpace, and Robin.
- Tools to optimize cleaning, energy use, and space allocation.
- Pros:
- Unparalleled depth of behavioral insights (not just presence) to inform design and policy.
- Strong focus on data privacy and anonymity, building trust with employees.
- Actionable intelligence presented in a clear, strategic dashboard for workplace leaders.
- Cons:
- Premium pricing reflects its enterprise focus and advanced capabilities.
- Requires physical hardware installation (sensors), which involves upfront planning and cost.
- Security & compliance: SOC 2 Type II certified, GDPR compliant by design (anonymous data). Data is encrypted in transit and at rest.
- Support & community: Dedicated customer success and strategic advisory services. Comprehensive knowledge base and regular industry insights webinars.
2 — SpaceIQ (now part of Eptura)
SpaceIQ, integrated into the Eptura workplace platform, is a comprehensive Integrated Workplace Management System (IWMS) with strong space analytics and management modules. It’s ideal for organizations that want analytics deeply embedded within a tool for managing moves, assets, maintenance, and space planning.
- Key features:
- Centralized space inventory and floor plan management (CAD/CAFM integration).
- Utilization tracking via sensor integrations or manual surveys.
- Scenario planning and “what-if” analysis for portfolio optimization.
- Stack planning and move management workflows.
- Reporting and dashboards on cost per seat, vacancy rates, and density.
- Part of a broader suite including asset management, maintenance, and desk booking.
- Pros:
- Analytics within a full IWMS context provides a single source of truth for all workplace data.
- Powerful planning and simulation tools for long-term portfolio strategy.
- Scalable for global portfolios with complex hierarchies and reporting needs.
- Cons:
- Can be complex and overwhelming for companies only seeking core utilization analytics.
- Implementation and configuration is a significant project best suited for larger enterprises.
- Security & compliance: Part of Eptura’s security framework, which includes SOC 2 compliance and enterprise-grade data protection measures.
- Support & community: Enterprise support with dedicated account management. Access to training and a community of corporate real estate professionals.
3 — OfficeSpace Software
OfficeSpace Software is a user-friendly, visual platform for space management, desk and room booking, and analytics. It excels at making complex space data accessible and actionable, particularly for organizations implementing flexible working models.
- Key features:
- Interactive, drag-and-drop floor plan editor that is easy for non-CAD users.
- Integrated desk and room booking with analytics on reservation vs. actual use.
- Utilization data from badge swipes, sensors, or booking check-ins.
- Employee directory and team placement tools.
- Reporting on key metrics like occupancy rates and booking trends.
- Mobile app for employees to find and book spaces.
- Pros:
- Exceptional ease of use and visual interface lowers the barrier to adoption for space managers.
- Seamlessly connects booking behavior with utilization analytics.
- Rapid implementation and intuitive setup compared to heavier IWMS solutions.
- Cons:
- Less focused on deep portfolio-level financial modeling and stack planning than pure-play IWMS tools.
- Advanced analytics may require integration with specialized sensor providers.
- Security & compliance: SOC 2 Type II certified, GDPR compliant. Offers SSO and robust permission controls.
- Support & community: Highly rated customer support, extensive help center, and an active user community for best practice sharing.
4 — Density
Density provides a unique, privacy-centric people counting solution using a specialized overhead sensor. Its focus is on delivering highly accurate, anonymous entry/exit counts to measure occupancy and flow in real-time.
- Key features:
- Purpose-built, 3D time-of-flight sensors that count people with over 99% accuracy without capturing imagery or PII.
- Real-time and historical dashboards showing occupancy, entrances, and exits.
- Capacity monitoring and alerts for safety, security, or space management.
- Flow analytics to understand peak traffic times and bottlenecks.
- Open API for easy integration into custom dashboards or other systems.
- Simple, subscription-based pricing per sensor.
- Pros:
- Industry-leading accuracy and unwavering commitment to privacy (no cameras, no facial recognition).
- Simple, clear data focused on occupancy counts, which is the foundational metric for many decisions.
- Easy to deploy and scale with a straightforward hardware + SaaS model.
- Cons:
- Provides count data, not behavioral or activity classification like some AI sensors.
- Primarily an entry/exit counter; understanding activity within a large, open space requires multiple sensors.
- Security & compliance: GDPR compliant by design, SOC 2 certified. The sensor hardware is intrinsically private.
- Support & community: Responsive support team, clear documentation, and a developer-friendly ecosystem around its API.
5 — Humanyze (by Entoptic)
Humanyze (now part of Entoptic) pioneered the use of organizational network analysis (ONA) and behavioral analytics. It combines badge-based sociometric sensors with email/calendar metadata (opt-in) to analyze collaboration patterns, communication networks, and workplace effectiveness.
- Key features:
- Organizational Network Analysis to map informal collaboration and communication flows.
- Badge-based sensors measuring proximity, interaction time, and movement (with strict privacy controls).
- Correlation of behavioral data with business outcomes like productivity, innovation, and retention.
- Insights into hybrid work patterns and their impact on team cohesion.
- Consultancy-led approach to translate data into organizational change programs.
- Pros:
- Unique focus on the human and social dynamics of the workplace, not just space.
- Powerful insights for HR and leadership on culture, collaboration, and management effectiveness.
- Evidence-based approach to workplace strategy and change management.
- Cons:
- Higher-touch, consultancy-driven model with less focus on self-service dashboards.
- Requires careful change management and employee consent due to the personal nature of the data.
- Not a traditional space utilization tool; used for different, more strategic questions.
- Security & compliance: Varies / N/A. Built with strong privacy and ethical data use frameworks. Compliance is managed on a project-by-project enterprise basis with strict anonymization and aggregation.
- Support & community: Support is intertwined with strategic advisory services from their team of workplace scientists and consultants.
6 — Locatee
Locatee is an analytics platform that specializes in turning existing corporate data—primarily Wi-Fi and network data—into actionable workplace utilization insights without the need for dedicated sensors.
- Key features:
- Utilization analysis using anonymized Wi-Fi/MAC address data from the existing network.
- Demand forecasting to predict future space needs.
- Detailed dashboards on occupancy, peak times, and space type popularity.
- Cleaning and services optimization recommendations.
- Portfolio analytics for multi-site comparisons.
- Privacy-by-design through immediate and irreversible anonymization.
- Pros:
- Leverages existing IT infrastructure, potentially offering a faster, lower-cost entry point than sensor networks.
- Strong forecasting and predictive capabilities.
- Well-suited for large, multi-national companies with established IT networks.
- Cons:
- Accuracy can be less precise than dedicated overhead sensors, especially in dense or dynamic environments.
- Dependent on the quality and coverage of the corporate Wi-Fi network.
- Provides presence data, not activity classification.
- Security & compliance: GDPR compliant, ISO 27001 certified. Emphasizes its privacy-by-design architecture.
- Support & community: Enterprise customer support and professional services to help interpret data and drive strategy.
7 — Infogrid
Infogrid is an AI-powered IoT platform that combines smart sensors for a wide range of workplace metrics—from occupancy and desk usage to air quality, energy consumption, and waste levels—into a single “smart building” dashboard.
- Key features:
- Wide ecosystem of wireless, easy-to-install sensors (occupancy, CO2, VOCs, temperature, humidity, etc.).
- AI that identifies trends and automates insights across building systems.
- Unified dashboard for sustainability, space utilization, and facility health.
- Automated compliance reporting for health, safety, and ESG (Environmental, Social, and Governance).
- Predictive maintenance alerts for facilities teams.
- Pros:
- Holistic view of workplace health, efficiency, and sustainability in one system.
- Quick, low-disruption deployment of wireless sensor grids.
- Turns raw data into automated, actionable alerts and reports.
- Cons:
- Broad focus can mean less depth in specialized space utilization analytics compared to best-in-class tools.
- Can become complex managing a large suite of different sensors and data streams.
- Security & compliance: SOC 2 Type II certified, GDPR compliant. Data is encrypted and secure.
- Support & community: Customer success team, knowledge base, and resources focused on smart building management.
8 — Kadence
Kadence is a hybrid work platform with analytics at its core. It focuses on optimizing the employee experience by connecting desk/room booking, team scheduling, and office signage with utilization data to guide employees and inform managers.
- Key features:
- Team-based scheduling and office day planning.
- Desk and room booking integrated with real-time availability.
- Utilization dashboards showing who’s in the office, which teams are present, and space usage.
- Insights to encourage effective office days (e.g., recommending days when key collaborators are in).
- Mobile and digital signage for wayfinding and notifications.
- Employee feedback tools to gauge sentiment.
- Pros:
- Strong employee-centric design that uses analytics to improve the daily experience.
- Promotes effective collaboration by making team presence and space availability clear.
- Lightweight and focused on solving hybrid work coordination problems.
- Cons:
- Analytics are tied to its booking ecosystem; less effective for measuring passive or unbooked space use.
- Not a portfolio-level real estate optimization tool for strategic CRE decisions.
- Security & compliance: SOC 2 compliant, GDPR ready. Implements standard enterprise security practices.
- Support & community: Responsive support and resources aimed at HR and workplace experience teams.
9 — Occupancy
Occupancy is a simple, cost-effective people counting and occupancy monitoring solution using IoT sensors. It emphasizes ease of use, clear visual dashboards, and practical applications like managing capacity limits and optimizing cleaning.
- Key features:
- People counting sensors for doors and entrances.
- Real-time occupancy dashboards and historical reports.
- Capacity monitoring and “live count” displays for lobbies or shared spaces.
- Cleaning and maintenance triggers based on usage data.
- Easy setup and configuration via a cloud-based portal.
- Affordable, predictable subscription pricing.
- Pros:
- Simplicity and affordability for core occupancy counting needs.
- Excellent for specific use cases like capacity management and service optimization.
- Quick and easy to deploy across many locations.
- Cons:
- Limited to entrance/exit counting and zone-level occupancy, not detailed in-space analytics.
- Lacks the advanced space planning and strategic analytics of enterprise platforms.
- Security & compliance: Varies. Uses standard IoT cloud security. Specific enterprise compliance would be custom.
- Support & community: Direct customer support and straightforward online resources.
10 — Clockwise (Optimizer)
Clockwise Optimizer is a unique AI-powered tool focused on optimizing time, not space. It analyzes company-wide calendars to find optimal times for meetings, create focus time blocks, and reduce meeting fatigue. For workspace analytics, it provides predictive data on when people plan to be in the office.
- Key features:
- AI that schedules meetings at the best possible time for all attendees.
- Automatically protects focus time on calendars.
- “Office Sync” feature that identifies and highlights days when teams are planning to be in the office together.
- Analytics on meeting load, focus time, and collaboration patterns.
- Integrations with Google Calendar, Outlook, Slack, and Zoom.
- Pros:
- Powerful for improving hybrid work coordination and calendar efficiency.
- Provides predictive intent data on office attendance, useful for planning space and services.
- Directly improves employee productivity and well-being by reducing calendar chaos.
- Cons:
- Not a physical space sensor tool; it analyzes calendar plans, not actual presence.
- Focused on the temporal aspect of work; must be combined with other tools for full space utilization insights.
- Security & compliance: SOC 2 Type II certified. Manages calendar data with high security and privacy standards.
- Support & community: Email support, help center, and resources for IT and people operations teams.
Comparison Table
| Tool Name | Best For (Target User) | Platform(s) Supported | Standout Feature | Rating |
|---|---|---|---|---|
| VergeSense | Enterprises needing deep behavioral insights & activity classification | Cloud Dashboard, API | AI-Powered Activity Detection & Privacy-Centric Design | N/A |
| SpaceIQ (Eptura) | Corporate real estate teams needing analytics within a full IWMS | Web, Mobile, CAD Integrations | Comprehensive IWMS with Advanced Space Planning & Simulation | N/A |
| OfficeSpace | Space managers implementing flexible work & needing visual ease-of-use | Web, Mobile App | User-Friendly Visual Space Mgmt. & Booking Integration | N/A |
| Density | Accurate, private people counting for occupancy & flow | Cloud Dashboard, API | 99%+ Accurate, Privacy-First People Counting Sensors | N/A |
| Humanyze | HR & leadership analyzing collaboration & organizational networks | Analytics Platform, Consultancy | Organizational Network Analysis (ONA) & Social Dynamics Insights | N/A |
| Locatee | Large enterprises wanting to leverage existing Wi-Fi data for insights | Cloud Dashboard | Utilization Analytics Using Existing Network Infrastructure | N/A |
| Infogrid | Facilities & sustainability teams wanting a unified smart building view | Cloud Dashboard | Holistic IoT Platform for Space, Air Quality, Energy & Compliance | N/A |
| Kadence | HR & workplace teams optimizing the hybrid employee experience | Web, Mobile App, Signage | Employee-Centric Hybrid Coordination & Experience Analytics | N/A |
| Occupancy | SMBs or specific use cases needing simple, affordable people counting | Cloud Dashboard | Simplicity & Affordability for Core Occupancy Monitoring | N/A |
| Clockwise | Optimizing team schedules & predicting office attendance intent | Web, Calendar Integrations | AI Calendar Optimization & Predictive Office Attendance Data | N/A |
Evaluation & Scoring of Workspace Analytics Tools
| Criteria | Weight | Explanation & What to Look For |
|---|---|---|
| Core Features | 25% | Accuracy and granularity of data (counts vs. activity), types of analytics (utilization, forecasting, ONA), quality of dashboards and reporting, and support for space planning simulations. |
| Ease of Use | 15% | Intuitiveness of the dashboard for business users, simplicity of sensor deployment/management, and clarity of data visualizations for stakeholders. |
| Integrations & Ecosystem | 15% | Ability to connect with booking systems (Robin, Envoy), IWMS (Archibus, IBM Tririga), HRIS, calendar systems, and building management systems (BMS). API flexibility. |
| Security & Compliance | 10% | Data encryption, anonymization practices, SOC 2 certification, GDPR/CCPA compliance, and clear privacy policies that support employee trust. |
| Performance & Reliability | 10% | Uptime of the platform, sensor/data feed reliability, speed of data processing and dashboard updates, and scalability across a global portfolio. |
| Support & Community | 10% | Quality of customer success and strategic advisory, technical support responsiveness, and access to a community or resources for best practices. |
| Price / Value | 15% | Total cost: sensor hardware, SaaS subscription, installation, and professional services. ROI based on real estate savings, efficiency gains, and improved employee experience. |
Which Workspace Analytics Tool Is Right for You?
- Solo Users vs. SMB vs. Enterprise: Small businesses with basic needs should look at Occupancy or the analytics within a booking tool like OfficeSpace. Mid-market companies need more robust data; VergeSense, Density, or OfficeSpace are strong. Large enterprises require scale, integration, and strategy; VergeSense, SpaceIQ (Eptura), and Locatee are enterprise-grade.
- Budget-Conscious vs. Premium: For cost-effective entry, Occupancy or leveraging network-based data (Locatee) can be smart. Premium solutions like VergeSense and Humanyze offer deeper, more strategic insights with corresponding pricing and services.
- Feature Depth vs. Ease of Use: SpaceIQ and VergeSense offer immense depth for specialists. OfficeSpace and Kadence prioritize ease of use and visual management. Density masters simplicity for its specific function (accurate counting).
- Integration and Scalability Needs: If you have a major IWMS, choose an analytics tool that integrates deeply (e.g., SpaceIQ is itself an IWMS). For a best-of-breed hybrid work stack, ensure compatibility with your booking app (OfficeSpace, Kadence). Global scalability requires cloud-native platforms with strong APIs.
- Security and Compliance Requirements: Enterprises, especially in regulated industries, must prioritize SOC 2 Type II certified platforms like VergeSense, OfficeSpace, and Infogrid. Any tool must have a clear, trustworthy privacy narrative to ensure employee buy-in.
Frequently Asked Questions (FAQs)
- Aren’t these tools just for “big brother” style employee monitoring?
No. Modern tools are designed with privacy-by-design. They focus on aggregate, anonymized analytics about space use, not individual tracking. The goal is to improve the workplace for everyone, not monitor productivity. Transparency about data use is key. - What’s more accurate: sensor data or Wi-Fi data?
Dedicated sensors (like VergeSense or Density) are typically more accurate for precise occupancy counts and location-specific data. Wi-Fi data (like Locatee) provides good directional trends and is less expensive to deploy but can be less precise and depends on device-carrying behavior. - How much can I actually save with these tools?
Savings come from right-sizing real estate (often 10-30% reduction in footprint), optimizing operations (cleaning, energy), and improving productivity. ROI studies often show payback in 12-24 months through real estate savings alone. - How do I ensure employee privacy and get buy-in?
Choose vendors with strong privacy credentials. Communicate clearly that the data is aggregated and anonymous, used to improve the office, not track individuals. Start with a pilot and share the insights and intended improvements back with employees. - Can I use data from my badge swipe or desk booking system instead?
Yes, this is a good starting point. However, badge data shows entry, not how space is used inside. Booking data shows intent, not actual use (“no-shows”). Dedicated sensors provide the “ground truth” of actual utilization. - What’s the difference between occupancy and utilization?
Occupancy is a simple count of people present. Utilization is a percentage measure of how much a space or asset is being used (e.g., a desk was occupied 40% of the workday). Utilization is more valuable for planning. - How long does it take to see useful data?
After installation, you can see real-time data immediately. However, to spot meaningful trends and patterns, you typically need to collect data for at least 4-6 weeks to account for weekly fluctuations and unusual events. - Do I need to hire a data scientist to use this?
No. Leading platforms are designed for business users (workplace managers, CRE leads) with intuitive dashboards. The value is in the vendor’s ability to translate data into plain-language insights and recommendations. - What’s the biggest mistake companies make?
Collecting data without a clear plan to act on it. Define your key business questions first (e.g., “Can we consolidate two floors?”). Start with a pilot focused on answering that question, then scale. Data without action leads to skepticism. - Should I start with a pilot?
Absolutely. A pilot in a representative area (one floor, one department) allows you to test technology, prove value, work through privacy questions, and build a case for a broader rollout with tangible data from your own environment.
Conclusion
Selecting the right workspace analytics tool is a strategic investment that turns the physical workplace from a cost center into a data-driven asset. The market offers specialized solutions for every need—from the deep behavioral insights of VergeSense and the human-focused analysis of Humanyze, to the simple, accurate counts from Density and the all-in-one management of OfficeSpace.
Remember, the “best” tool is the one that answers your most pressing business questions, aligns with your company’s privacy values, and integrates into your existing operational workflows. Prioritize data accuracy and trustworthiness, actionable insights over raw data, and a vendor partnership that helps you translate numbers into a better workplace strategy. By starting with a clear goal and a thoughtful pilot, you can choose a platform that empowers you to create a more efficient, effective, and engaging workplace for the future of work.

- Top 10 Email Deliverability Tools: Features, Pros, Cons & Comparison - September 6, 2026
- Top 10 Pharmacovigilance Software: Features, Pros, Cons & Comparison - September 6, 2026
- Top 10 Manufacturing Execution Systems (MES) - July 30, 2026