Joomla Website Performance

SEO and PERFORMANCE

http://www.joomlaaa.com/Joomla-Articles/optimization/How-can-I-make-my-Joomla-site-load-faster.html

http://www.joomlaperformance.com

http://www.websiteoptimization.com

http://www.pathos-seo.com/joomla-technical-optimization/making-a-faster-joomla-website.html

http://www.pathos-seo.com/joomla-technical-optimization/making-a-faster-joomla-website.html


http://www.wzcreativetechnology.com/joomla-tips-and-tricks/74-how-to-make-joomla-site-load-fast.html

http://extensions.joomla.org/extensions/site-management/cache/7350

http://www.open-source-depot.com/archives/13-MySQL-Performance-Tip-on-CentOS4-on-GoDaddy.html

http://www.open-source-depot.com/archives/13-MySQL-Performance-Tip-on-CentOS4-on-GoDaddy.html

http://www.cyberciti.biz/tips/enable-the-query-cache-in-mysql-to-improve-performance.html


http://forum.joomla.org/viewtopic.php?f=433&t=344013l

http://kb.siteground.com/article/How_to_optimize_a_MySQL_database_using_phpMyAdmin.html

http://www.electrictoolbox.com/mysql-optimize-table-cli/

http://forum.joomla.org/viewtopic.php?p=1250059

http://kb.siteground.com/article/How_to_optimize_a_MySQL_database.html

http://developer.yahoo.com/performance/rules.html

http://www.mightyjoomla.com/Joomla-Tips-Tricks/enable-and-use-gzip-compression-in-joomla-cms-to-enhance-website-performance.html

http://forum.joomla.org/viewtopic.php?t=50278


www.websiteoptimization.com/services/analyze/


http://forum.joomla.org/viewtopic.php?t=50278

http://www.phpmagicbook.com/htaccess-essential-tricks-for-blog-website-performance-a-guide/

http://www.dquinn.net/htaccess-adding-etags-gzip-expires-headers/

Tagged : / / / / / / / /

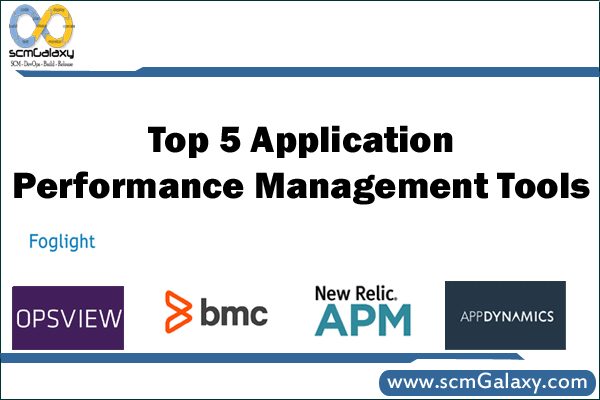
Top 5 Application Performance Management Tools

top-application-performance-management-tools
This is the age of applications. We are using various applications in our day-to-day life to get our things done or to get information and for various other things. Therefore, applications are now playing a vital role in our life and so that for today’s businesses. In these days organisations whether they are small or large they somehow rely upon applications for there marketing, customer relations or engagements or to reach them directly and for various other reasons. Therefore, it’s really important to manage application performance so that business runs smoothly and generate productivity continuously and users can get what they want. Simply means to say everyone benefits when applications run at their best.
But, how to know is your application is performing well or not ? You can not test them manually every time or You can not wait when the users will call the customer support with issues. Right?
So, Here comes the solution “Application Performance Management” Tools. Let’s see what it is and it’s importance ?
Application performance management or APM is a kind of practice through which you can easily detect and short out the issues which occurs in applications while using, so that your application users have a good experience with it. Actually, APM monitors and manage the performance, availability and security of the application. It provides data to the administrators which makes their job easy to find the issues and resolve before it impacts on application performance.
Now, let’s check out the major benefits of Application performance management
1. Reduce Downtime (Availability) – When you integrate APM tool you can decrease your application downtime by 80 to 90 percent.
2. End User Experience – The main purpose of any application is to satisfy the user or to give them a quality experience while using there platform and APM makes it possible.
3. Generate Leads – If your application is for ecommerce or for sales perspective than it’s really important that it’s perform well so that you don’t miss the opportunity to generate the sales or leads in your business.
4. Productivity – APM can help you to save your time in troubleshooting which ultimately means you have more time to implement other things and for changes and monitoring.
Now let’s move on to the section where, You will get the real benefit of this article. All these things cannot possible without a right tool. So, I have done some research and make this list of Top 5 Application Performance Management Tools.
Here is the list:-

1. New Relic APM


New Relic APM

Highlights
  • Application Monitoring
  • Deployment Analysis, History, and Comparison
  • Database Monitoring
  • Availability & Error Monitoring
  • Complete report
  • Team Collaboration – Team can work together
  • Secure

2. AppDynamics


AppDynamics

Highlights
  • End-to-end transaction tracing
  • Troubleshooting and control
  • Code level visibility
  • Scalability
  • Dynamic baselining and alerting
  • Data retention

3. Foglight


Foglight
Highlights
  • Integrated transaction- and customer-centric application performance monitoring
  • User Experience Monitoring
  • Transaction DNA
  • Advanced analytics
  • Enhanced collaboration
4. BMC Software APM
BMC Software APM
Highlights
  • Application Centric Infrastructure Monitoring
  • Synthetic Testing
  • End user experience monitoring
  • Deep dive diagnostic
5. OpsView

OpsView

Highlights
  • Track and alert on application health
  • Group apps by business process
  • Set thresholds to trigger alerts
  • Ensure business services are meeting SLAs
  • Supports monitoring of major application servers
  • Synthetic transactions to monitor end-to-end performance
So, This is my list of Application Performance Management Tools. Hope you guys will like my efforts and if you think this list should contain some other tools instead of this than feel free to share with us in the comment section below.
Tagged : / / / / / / / / / / / / / / / / /

Source code analysis tools: Evaluation criteria

code-analysis-tools-evaluation-criteria

Source code analysis tools: Evaluation criteria

Support for the programming languages you use. Some companies support mobile devices, while others concentrate on enterprise languages like Java, .Net, C, C++ and even Cobol.

Good bug-finding performance, using a proof of concept assessment. Hint: Use an older build of code you had issues with and see how well the product catches bugs you had to find manually. Look for both thoroughness and accuracy. Fewer false positives means less manual work.

Internal knowledge bases that provide descriptions of vulnerabilities and remediation information. Test for easy access and cross-referencing to discovered findings.

Tight integration with your development platforms. Long-term, you’ll likely want developers to incorporate security analysis into their daily routines.

A robust finding-suppression mechanism to prevent false positives from reoccurring once you’ve verified them as a non-issue.

Ability to easily define additional rules so the tool can enforce internal coding policies.

A centralized reporting component if you have a large team of developers and managers who want access to findings, trending and overview reporting

Tagged : / / / / / / / / / / / / / / / / / /

Performance Optimization of Build Server | Performance Optimization Guide

build-server

Performance Optimization Checklist of Build Servers

Build Infrastructure Level

1.  Do you really need to build all source code or only the part of code which has changes?

2. Project should be divided into multiple modules/component which can be build independently and should be integrated when it needed.

3. Understand technology and make use of performance related features which will help you. e.g make, visual studio and maven has some feature which help us to compile only code which was changed also, some performance tuning features should be explored.

4. Compile dependent project only there are changes. no need to compile all the time.

5. Distribute application in non-compiled and to be compiled files. e.g src, docs and copy only src to comile. docs files cane be used while creating installer.

6. Plan for disk usage growth upfront.

Application Server level

  1. Apache Server optimization and proper log setting
  2. Disabling unused modules and component which will help performance.
  3. Follow best practices of Module Configuration, Apache Server Configuration etc

 System level

  1. Check if any background task/services is running which is consuming cpu/memory and can be  stopped and not relevant.
  2. Keep system uptodate
  3. Avoid using build server for any other task – If you must edit components or install software, build or edit the components on another machine and copy them over.
  4. Use high speen drive for i/o operations

Build Server application level

http://www.cloudbees.com/sites/default/files/whitepapers/7WaysToOptimizeJenkins.pdf

  1. Keep log files maintenance and truncate regularly. have limited build records.
  2. Move build to document server. not to keep in build server
  3. Take advantage of distribute build server using agents/slaves/nodes etc
Tagged : / / / / / / / / / / / / / / /

Linux Performance Monitoring using iostat, mpstat and vmstat | Linux Performance Monitoring Guide

linux-performance-monitoring

iostat reports CPU, disk I/O, and NFS statistics.

mpstat reports processors statictics.
vmstat reports virtual memory statistics.

vxstat – This Utility can be used as well.

iostat reports CPU, disk I/O, and NFS statistics.

The iostat command generates two types of reports, the CPU Utilization report and the Device Utilization report. The first report generated by the iostat command is the CPU Utilization Report.

iostat commands Table
iostat Iostat without any argument displays information about the CPU usage, and I/O statistics
iostat -c Display only cpu statistics
iostat -d Display only disk I/O statistics
iostat -n Display only network statistics (device and NFS statistics)
iostat -m Display the device I/O statistics in Blocks and To change I/O data in MB/second
iostat –p Display I/O statistics only for a device(data for all the disks available in the system)
iostat -t By default iostat displays only the current date. To display the current time, use this option
iostat -x Display extended disk I/O statistics information
iostat -x sda1 Display Extended status of device sda1
iostat 2 Execute Every 2 seconds (until you press Ctl-C)
iostat 2 3 To execute every 2 seconds for a total of 3 times
iostat -N To display the LVM statistics use option -N as shown below.
iostat –V To Display Version
iostat -d -x Display only disk I/O statisticsin in extended form
iostat -d -x sda Display only sda device I/O statisticsin in extended form
iostat -Td -xdn 5 For Solaris
iostat -d -x 5 For Linux
if Average read or write times over 50 ms, this should be consider for serious i/o problems

The report has the following format:

%user – Show the percentage of CPU utilization that occurred while executing at the user level (application).
%nice – provides statistics on a per physical device or partition basis.
Device – This column gives the device name
tps – Indicate the number of transfers per second that were issued to the device. A transfer is an I/O request to the device.
Blk_read/s – Indicate the amount of data read from the drive expressed in a number of blocks per second.
Blk_wrtn/s – Indicate the amount of data written to the drive expressed in a number of blocks per second.
Blk_read – The total number of blocks read.
Blk_wrtn – The total number of blocks written.
kB_read/s – Indicate the amount of data read from the drive expressed in kilobytes per second.
kB_wrtn/s – Indicate the amount of data written to the drive expressed in kilobytes per second.
wrqm/s – The number of write requests merged per second that were issued to the device.
r/s – The number of read requests that were issued to the device per second.
w/s – The number of write requests that were issued to the device per second.
rsec/s – The number of sectors read from the device per second.
wsec/s – The number of sectors written to the device per second.
await – The average time (in milliseconds) for I/O requests issued to the device to be served.
svctm – The average service time (in milliseconds) for I/O requests that were issued to the device.
%util – Percentage of CPU time during which I/O requests were issued to the device.

vmstat reports virtual memory statistics.

vmstat -a Display active and inactive memory
vmstat -f Display number of forks since last boot
vmstat 2 Execute Every x seconds (for y number of times)
vmstat -t 1 100 Display timestamp
vmstat -V version info
vmstat -m Display slab info
vmstat -s Display statistics in a table format
vmstat -d Use option -d to display the disk statistics as shown below. This displays the reads, writes, and I/O statistics of the disk.
vmstat 1 3 vmstat – Increase the width of the display
vmstat -p sdb1 Display statistics for a partition
vmstat -S m Display in MB

The report has the following format:

Procs – r: Total number of processes waiting to run
Procs – b: Total number of busy processes
Memory – swpd: Used virtual memory
Memory – free: Free virtual memory
Memory – buff: Memory used as buffers
Memory – cache: Memory used as cache.
Swap – si: Memory swapped from disk (for every second)
Swap – so: Memory swapped to disk (for every second)
IO – bi: Blocks in. i.e blocks received from device (for every second)
IO – bo: Blocks out. i.e blocks sent to the device (for every second)
System – in: Interrupts per second
System – cs: Context switches
CPU – us, sy, id, wa, st: CPU user time, system time, idle time, wait time

mpstat reports processors statictics.

reports processors statictics(mpstat – Report processors related statistics and mpstat displays CPU statistics )

mpstat :- mpstat displays CPU statistics
mpstat -A :- Display all information
mpstat -P ALL :- Display CPU statistics of individual CPU (or) Core

Reference:
http://www.linux-tutorial.info/modules.php?name=ManPage&sec=1&manpage=iostat
http://www.thegeekstuff.com/2011/07/iostat-vmstat-mpstat-examples/

Tagged : / / / / / / / / / / / / / / / / / / /