Top 50 Prometheus Interview Questions with Answers

Prometheus Interview Questions with Answers
  1. What is Prometheus?
    A) A monitoring and alerting system
    B) A virtual machine
    C) A database management system
    D) A web server

Ans: A) A monitoring and alerting system

  1. Who created Prometheus?
    A) Microsoft
    B) Google
    C) Amazon
    D) Facebook

Ans: B) Google

  1. What is the purpose of Prometheus?
    A) To store data
    B) To monitor applications
    C) To manage databases
    D) To create virtual machines

Ans: B) To monitor applications

  1. What is the primary language used by Prometheus?
    A) Python
    B) Ruby
    C) Go
    D) Java

Ans: C) Go

  1. Which component of Prometheus stores time-series data?
    A) Prometheus Server
    B) Pushgateway
    C) Alertmanager
    D) Exporters

Ans: A) Prometheus Server

  1. What is Grafana?
    A) A database management system
    B) A web server
    C) A monitoring and alerting system
    D) A visualization tool

Ans: D) A visualization tool

  1. What is the default port for Prometheus instance?
    A) 8090
    B) 9090
    C) 9999
    D) 8888

Ans: B) 9090

  1. How does Prometheus collect data?
    A) Through scraping
    B) Through logging
    C) Through polling
    D) Through streaming

Ans: A) Through scraping

  1. What is the role of the Pushgateway?
    A) To push metrics to Grafana
    B) To receive data sent by Prometheus
    C) To collect data from multiple sources
    D) To generate alerts

Ans: B) To receive data sent by Prometheus

  1. What is an exporter in Prometheus?
    A) A tool to export data to a database
    B) A tool to export data to another monitoring system
    C) A tool to export data for visualization
    D) A tool to collect metrics from services

Ans: D) A tool to collect metrics from services

  1. What is a Prometheus client library?
    A) A tool to monitor client-side applications
    B) A tool to create client-side applications
    C) A tool to collect metrics from client-side applications
    D) A tool to manage client-side applications

Ans: C) A tool to collect metrics from client-side applications

  1. How does Prometheus handle alerting?
    A) Through a separate component called Alertmanager
    B) By sending emails
    C) Through integration with third-party alerting systems
    D) By creating tickets in issue tracking systems

Ans: A) Through a separate component called Alertmanager

  1. What is the role of relabeling in Prometheus?
    A) To filter out unwanted metrics
    B) To modify metric labels
    C) To group metrics
    D) To aggregate metrics

Ans: B) To modify metric labels

  1. What is federation in Prometheus?
    A) A way to share data between multiple Prometheus instances
    B) A way to distribute data to multiple monitoring systems
    C) A way to synchronize data between Grafana and Prometheus
    D) A way to store data in multiple databases

Ans: A) A way to share data between multiple Prometheus instances

  1. What is the purpose of recording rules in Prometheus?
    A) To aggregate metrics
    B) To modify metrics
    C) To generate alerts
    D) To create new time-series data

Ans: D) To create new time-series data

  1. What is Continuous Integration (CI) in Prometheus?
    A) A way to continuously monitor applications
    B) A way to continuously test applications
    C) A way to deploy applications
    D) A way to build applications

Ans: B) A way to continuously test applications

  1. What is Continuous Delivery (CD) in Prometheus?
    A) A way to continuously monitor applications
    B) A way to continuously test applications
    C) A way to deploy applications
    D) A way to build applications

Ans: C) A way to deploy applications

  1. What is Continuous Deployment (CD) in Prometheus?
    A) A way to continuously monitor applications
    B) A way to continuously test applications
    C) A way to deploy applications
    D) A way to build applications

Ans: C) A way to deploy applications

  1. What is the difference between monitoring and logging?
    A) Monitoring is real-time, while logging is not
    B) Logging is real-time, while monitoring is not
    C) Monitoring captures metrics, while logging captures events
    D) Logging captures metrics, while monitoring captures events

Ans: C) Monitoring captures metrics, while logging captures events

  1. What is the role of node_exporter in Prometheus?
    A) To collect metrics from a single node
    B) To collect metrics from multiple nodes
    C) To aggregate metrics from multiple nodes
    D) To generate alerts for node failures

Ans: A) To collect metrics from a single node

  1. What is the role of kube-state-metrics in Prometheus?
    A) To collect metrics from Kubernetes services
    B) To collect metrics from Kubernetes nodes
    C) To collect metrics from Kubernetes pods and containers
    D) To generate alerts for Kubernetes services

Ans: C) To collect metrics from Kubernetes pods and containers

  1. What is the role of cAdvisor in Prometheus?
    A) To collect metrics from Kubernetes services
    B) To collect metrics from Kubernetes nodes
    C) To collect metrics from Kubernetes pods and containers
    D) To generate alerts for Kubernetes services

Ans: C) To collect metrics from Kubernetes pods and containers

  1. What is the purpose of Blackbox exporter in Prometheus?
    A) To collect metrics from web applications
    B) To collect metrics from network devices
    C) To collect metrics from databases
    D) To collect metrics from storage devices

Ans: A) To collect metrics from web applications

  1. What is the purpose of SNMP exporter in Prometheus?
    A) To collect metrics from web applications
    B) To collect metrics from network devices
    C) To collect metrics from databases
    D) To collect metrics from storage devices

Ans: B) To collect metrics from network devices

  1. What is the role of the Alertmanager in Prometheus?
    A) To collect metrics
    B) To generate alerts
    C) To visualize data
    D) To modify metrics

Ans: B) To generate alerts

  1. What kind of data does Prometheus store?
    A) Structured data
    B) Unstructured data
    C) Semi-structured data
    D) NoSQL data

Ans: A) Structured data

  1. What is the difference between counters and gauges in Prometheus?
    A) Counters are cumulative, while gauges can go up and down
    B) Counters can go up and down, while gauges are cumulative
    C) Counters and gauges are the same thing
    D) Counters and gauges are not used in Prometheus

Ans: A) Counters are cumulative, while gauges can go up and down

  1. What are histograms in Prometheus?
    A) A way to count occurrences of events
    B) A way to calculate the average value of a metric
    C) A way to calculate percentiles for a metric
    D) A way to group metrics based on labels

Ans: C) A way to calculate percentiles for a metric

  1. What is the difference between percentiles and quantiles?
    A) There is no difference
    B) Percentiles are expressed as fractions, while quantiles are expressed as percentages
    C) Quantiles are expressed as fractions, while percentiles are expressed as percentages
    D) Quantiles and percentiles are calculated differently

Ans: C) Quantiles are expressed as fractions, while percentiles are expressed as percentages

  1. What is the purpose of bucketing in Prometheus histograms?
    A) To group data based on labels
    B) To count occurrences of events
    C) To calculate percentiles
    D) To group data in predefined ranges

Ans: D) To group data in predefined ranges

  1. What is the role of scrape_configs in Prometheus configuration?
    A) To configure exporters
    B) To configure Prometheus instances
    C) To configure Alertmanager
    D) To configure Grafana

Ans: A) To configure exporters

  1. What is the role of job_configs in Prometheus configuration?
    A) To configure exporters
    B) To configure Prometheus instances
    C) To configure Alertmanager
    D) To configure Grafana

Ans: B) To configure Prometheus instances

  1. What is the purpose of relabel_configs in Prometheus configuration?
    A) To filter out unwanted metrics
    B) To modify metric labels
    C) To group metrics
    D) To aggregate metrics

Ans: B) To modify metric labels

  1. What is the function of rules_files in Prometheus configuration?
    A) To configure alerting rules
    B) To configure recording rules
    C) To configure pushgateway
    D) To configure federation

Ans: B) To configure recording rules

  1. What is the role of service discovery in Prometheus?
    A) To discover new metrics
    B) To discover new targets for scraping
    C) To discover new Prometheus instances
    D) To discover new exporters

Ans: B) To discover new targets for scraping

  1. What is the difference between static and dynamic service discovery in Prometheus?
    A) There is no difference
    B) Static service discovery requires manual configuration, while dynamic service discovery is automated
    C) Dynamic service discovery requires manual configuration, while static service discovery is automated
    D) Static and dynamic service discovery are not used in Prometheus

Ans: B) Static service discovery requires manual configuration, while dynamic service discovery is automated

  1. What is the role of relabeling in Prometheus alerts?
    A) To filter out unwanted alerts
    B) To modify alert labels
    C) To group alerts
    D) To aggregate alerts

Ans: B) To modify alert labels

  1. What is the difference between a rule and an alert in Prometheus?
    A) There is no difference
    B) A rule creates new metrics, while an alert generates notifications based on metrics
    C) A rule aggregates metrics, while an alert modifies metrics
    D) A rule modifies labels, while an alert modifies values

Ans: B) A rule creates new metrics, while an alert generates notifications based on metrics

  1. What is the role of the prometheus.yml file in Prometheus configuration?
    A) To configure Alertmanager
    B) To configure exporters
    C) To configure Prometheus instances
    D) To configure Grafana

Ans: C) To configure Prometheus instances

  1. What is the role of the external labels in Prometheus configuration?
    A) To add metadata to a metric
    B) To modify metric labels
    C) To group metrics
    D) To aggregate metrics

Ans: A) To add metadata to a metric

  1. What is the purpose of the scrape_interval configuration in Prometheus?
    A) To define how often Prometheus scrapes targets
    B) To define how long metrics are retained in Prometheus
    C) To define how often Alertmanager generates notifications
    D) To define how often Grafana requests data from Prometheus

Ans: A) To define how often Prometheus scrapes targets

  1. What is the purpose of the evaluation_interval configuration in Prometheus?
    A) To define how often Prometheus scrapes targets
    B) To define how long metrics are retained in Prometheus
    C) To define how often Alertmanager generates notifications
    D) To define how often Prometheus evaluates rules

Ans: D) To define how often Prometheus evaluates rules

  1. What is the purpose of the retention configuration in Prometheus?
    A) To define how often Prometheus scrapes targets
    B) To define how long metrics are retained in Prometheus
    C) To define how often Alertmanager generates notifications
    D) To define how often Prometheus evaluates rules

Ans: B) To define how long metrics are retained in Prometheus

  1. What is the purpose of the alert_history configuration in Prometheus?
    A) To store generated alerts
    B) To store metrics data
    C) To store configuration data
    D) To store visualization data

Ans: A) To store generated alerts

  1. What is a pushgateway in Prometheus?
    A) A way to store metrics data
    B) A way to aggregate metrics data
    C) A way to push metrics data to another system
    D) A way to generate alerts

Ans: C) A way to push metrics data to another system

  1. What is the purpose of the scrape_timeout configuration in Prometheus?
    A) To define how long Prometheus spends scraping a target
    B) To define how long Prometheus retains metrics data
    C) To define the rate at which Prometheus scrapes targets
    D) To define the rate at which Prometheus evaluates rules

Ans: A) To define how long Prometheus spends scraping a target

  1. What is the role of the target_relabel_configs in Prometheus configuration?
    A) To filter out unwanted targets
    B) To modify target labels
    C) To group targets
    D) To aggregate targets

Ans: B) To modify target labels

  1. What is the role of the metric_relabel_configs in Prometheus configuration?
    A) To filter out unwanted metrics
    B) To modify metric labels
    C) To group metrics
    D) To aggregate metrics

Ans: B) To modify metric labels

  1. What is the role of the external_url configuration in Prometheus?
    A) To define the URL for Prometheus server
    B) To define the URL for Grafana server
    C) To define the URL for Alertmanager server
    D) To define the URL for pushgateway server

Ans: A) To define the URL for Prometheus server

  1. What is the role of the HTTP API in Prometheus?
    A) To provide a web interface for Prometheus
    B) To export metrics to other systems
    C) To provide a RESTful interface for Prometheus
    D) To store metrics data

Ans: C) To provide a RESTful interface for Prometheus

What is Prometheus & grafana and best course and certification in India?

Prometheus is an open-source system monitoring and alerting toolkit originally built at SoundCloud. Many companies and organizations have adopted Prometheus and have a very active developer and user community in the project. It is now a standalone open-source project and is maintained independently of any company.

Features of Prometheus:

  • A multi-dimensional data model with time series data identified by metric name and key/value pairs.
  • PromQL, a flexible query language to leverage this dimensionality.
  • No reliance on distributed storage; single server nodes are autonomous.
  • Time series collection happens via a pull model over HTTP.

What is Grafana?

Grafana is an open-source solution for running data analytics, understanding large amounts of data and monitoring our apps with the help of cool customizable dashboards.

What are the benefits of Grafana?

  • Customizable dashboards are feature-rich and can be configured to display data from a wide range of databases using visualization tools such as heatmaps, histograms, and charts.
  • The platform is flexible and easy to use.
  • Native support of a broad range of databases.

Grafana Features:

  • Dashboard templating – This is a Grafana feature that is really useful. It allows users to create a dashboard setup to suit their every need.
  • Provisioning – It can be simple enough to set up a single dashboard with a few clicks, dragging and dropping, but some users need even more ingenuity this way.
  • Annotations – This Grafana feature lets you mark graphs, which is especially helpful when you need to correlate data in case something misbehaves.
  • Custom plugins – You can extend the functionality of Grafana with plugins that provide additional tools, visualizations, and more.
  • Teams and permissions – Where an organization has an instance of Grafana and multiple teams, they usually prefer to have the option of implementing some dashboard isolation.

Pre-requisites to learn Prometheus and Grafana:

  • Basic experience with Linux/Unix system administration.
  • Familiarity with common shell commands, such as ls, cd, curl, etc.
  • Some knowledge and/or development experience in Go and Python.
  • Some experience working with Kubernetes.

If you are planning to learn Prometheus and Grafana, go with DevOpsSchool institute. Will provide you online and classroom training and certification course Program by an expert. To get in-depth knowledge of Prometheus and Grafana along with its various applications, check out our interactive, live-online training.

Here you can see the Agenda of Prometheus and Grafana Course:

This course covers the basics of Prometheus and Grafana and their main features. You will develop a critical understanding of why Prometheus and Grafana are useful and how they can be combined with other web development frameworks.

You will learn about the basics of Prometheus and Grafana and their advantages. Then, you’ll cover more advanced topics like integrating Prometheus and Grafana with other frameworks.

Hopefully, I think this information is helpful for you.

However, if you want to find out more details, be sure to check out our Prometheus and Grafana course to learn more about this technology.

Tagged : / / / / /

What is Prometheus, Grafana, and How to learn Online?

Prometheus is an open-source system monitoring and alerting toolkit originally built at SoundCloud. Many companies and organizations have adopted Prometheus and have a very active developer and user community in the project. It is now a standalone open-source project and is maintained independently of any company.

Features of Prometheus:

  • A multi-dimensional data model with time series data identified by metric name and key/value pairs.
  • PromQL, a flexible query language to leverage this dimensionality.
  • No reliance on distributed storage; single server nodes are autonomous.
  • Time series collection happens via a pull model over HTTP.

What is Grafana?

Grafana is an open-source solution for running data analytics, understanding large amounts of data, and monitoring our apps with the help of cool customizable dashboards.

What are the benefits of Grafana?

  • Customizable dashboards are feature-rich and can be configured to display data from a wide range of databases using visualization tools such as heatmaps, histograms, and charts.
  • The platform is flexible and easy to use.
  • Native support of a broad range of databases.

Grafana Features:

  • Dashboard templating – This is a Grafana feature that is really useful. It allows users to create a dashboard setup to suit their every need.
  • Provisioning – It can be simple enough to set up a single dashboard with a few clicks, dragging and dropping, but some users need even more ingenuity this way.
  • Annotations – This Grafana feature lets you mark graphs, which is especially helpful when you need to correlate data in case something misbehaves.
  • Custom plugins – You can extend the functionality of Grafana with plugins that provide additional tools, visualizations, and more.
  • Teams and permissions – Where an organization has an instance of Grafana and multiple teams, they usually prefer to have the option of implementing some dashboard isolation.

Pre-requisites to learn Prometheus and Grafana:

  • Basic experience with Linux/Unix system administration.
  • Familiarity with common shell commands, such as ls, cd, curl, etc.
  • Some knowledge and/or development experience in Go and Python.
  • Some experience working with Kubernetes.

How Long Does it Take to Learn Prometheus and Grafana?

Typically, Prometheus and Grafana training by DevOpsSchool will let you master the concepts in about 2 months if you devote 2 to 4 hours per week. The training takes place in such a way that you become proficient in almost all the concepts of Prometheus and Grafana can easily add certification to your resume.

How to Learn Prometheus and Grafana?

The first thing you should do before learning Prometheus and Grafana is to ask yourself how you learn best.

Do you prefer online tutorials, or do you prefer online courses? Do you want to work on projects as part of a team, or are you comfortable learning at your own pace? By considering this question in advance, you will be able to better understand what kind of material you should be looking for.

If you are planning to learn Prometheus and Grafana, go with DevOpsSchool institute. Will provide you online and classroom training and certification course Program by an expert. To get in-depth knowledge of Prometheus and Grafana along with its various applications, check out our interactive, live-online training.

Here you can see the Agenda of Prometheus and Grafana Course:

This course covers the basics of Prometheus and Grafana its main features. You will develop a critical understanding of why Prometheus and Grafana are useful and how they can be combined with other web development frameworks.
You will learn about the basics of Prometheus and Grafana its advantages. Then, you’ll cover more advanced topics like integrating Prometheus and Grafana with other frameworks.

Hopefully, I think this information is helpful for you.

However, if you want to find out more details, be sure to check out our Prometheus and Grafana course to learn more about this technology.

Tagged : / / /

Complete guide of Prometheus with Grafana Certification courses, tutorials, and training

Tutorial
Prometheus is an associate open provide systems observance system that Grafana provides out-of-the-box support. this subject walks you through the steps to create a series of dashboards in Grafana to indicate system metrics for a server monitored by Prometheus.

What is Prometheus with Grafana?

Prometheus could be an observance answer for storing time-series knowledge like metrics. Grafana permits visualizing the information keep in Prometheus and different sources. This sample demonstrates the way to capture NServiceBus metrics, storing these in Prometheus and visualizing these metrics victimization Grafana.

Why do we need Prometheus with Grafana?

The combination of OSS grafana and Prometheus is turning into an additional and additional common observation stack utilized by DevOps groups for storing and visualizing statistic information. Prometheus acts because of the storage backend and open supply grafana because of the interface for analysis and visual image.

How does Prometheus work with Grafana?

Prometheus acts because of the storage backend and open supply grafana because of the interface for analysis and visual image. Prometheus collects metrics from monitored targets by scraping metrics from HTTP endpoints on these targets. handily, Prometheus exposes a large sort of metrics that will be simply monitored.

Key Features of Grafana and Prometheus

Key features of Grafana include-

  • Alert systems.
  • Unifies your data.
  • Dashboard sharing.

Prometheus excels in features like-

  • Provides time series data.
  • Flexible query language, PromQL allows users to select data in real-time.
  • Multi-dimensional data model.

Key Strengths of the Grafana and Prometheus

Following are the key strengths of Grafana-

  • Analytics and monitoring tool.
  • Visualizing system CPU, memory, I/O utilization metrics.
  • Creating custom dashboards.
  • Integration with tools like Prometheus, Graphite, InfluxDB, MySQL.

Below mentioned are the key strengths for Prometheus-

  • Supports machine-centric and service-oriented architecture monitoring.
  • Availability of viewing statistics of a system.
  • Efficient storage.

Prometheus and Grafana Training and Certification

Prometheus is in style open-source observance and alerting tool with attention to dependableness and ease. The computer code was developed as a result of the requirement to observe varied microservices that may be running in your system. Prometheus is written within the Go language, and it ships with simply divided binaries that one will use to urge it to run as quickly as attainable.

DevOpsSchool places each leap forward to instruct participants from basic to Advance level courses of Prometheus. we’ve got well-experienced trainers and Instructors United Nations agency hold recognition within the IT business. Our mentors offer support to candidates whereas learning and thru coaching.

Agenda of the Prometheus with Grafana

About the course: Prometheus with Grafana

Our instructor-led Prometheus and Grafana coaching course can enable you to explore and learn to form observability solutions to observe and visualize the performance and health standing of your distributed systems, apps, and containerized clusters.

Practical active exercises can offer you the talents to place in situ effective metrics, dashboards, and alerts therefore you’ll be able to make sure the performance and strength of the platforms you support like Docker, Kubernetes, and more.

This course is out there as a part of a wider educational program or as a customizable standalone workshop – seek advice from us concerning however we will tailor your coaching to suit in together with your existing skills, your current school stack, and your learning goals.

Through custom coaching, we will show you how to install, assemble and deploy Prometheus and/or Grafana to live the performance and health of platforms as well as Kubernetes, Docker, Puppet, Spring Boot, Node …the list is large.

Conclusion

We have seen that Grafana provides a seamless thanks to connecting with the Prometheus knowledge supply and it provides nice visualization through queries. attempt it out mistreatment the DevOpsSchool, where you’ll be able to use Grafana right in our internet platform. Also, book a demo and consult with us directly. We’re forever happy to speak regarding your company’s observance wants.

Thank you!

Tagged : / / / / / /

Everything you need to know about Prometheus

What is Prometheus?

Prometheus is analogous in style to Google’s Borgmon observance system, and a comparatively modest system will handle the aggregation of many thousands of metrics each second. Properly tuned and deployed, a Prometheus cluster will collect various metrics each second. Prometheus may be a metrics assortment and alerting tool developed and discharged to open supply by SoundCloud. Prometheus do I factor and it will it well. It’s a straightforward nevertheless powerful knowledge model and a question language that enables you to analyze however your applications and infrastructure square measure playacting. It doesn’t try and solve issues outside of the metrics area, departure those to alternative additional acceptable tools.

Why do we need Prometheus?
Prometheus is open-source monitoring software that is very popular in the industry. Prometheus is straightforward to customize and produces metrics while not impacting application performance alongside this. This observance is often accustomed to offer clarity into systems and the way to run them.

What are the benefits of Prometheus?

  • Prometheus is TSDB – Prometheus is TSDB, statistic information. A TSDB may be a piece of information optimized for time-sealed or statistic knowledge. Statistics knowledge are merely measurements or events that are half-tracked, monitored, downsampled, and mass over time.

  • Prometheus the Pull-based tool – Prometheus actively scrapes targets so as to retrieve metrics from them. Node businessperson and App businesspersons can listen on a specific port and the Prometheus server initiate an HTTP decision to the current specific exporter and fetch system/app metrics from finish points. Prometheus expects to retrieve metrics via HTTP calls done to sure endpoints that are outlined in Prometheus configuration.

  • Centralized control – A pull-based system permits rate management with the flexibleness of getting multiple scrap configurations, so multiple routes for various targets. This implies you’ll be able to decide UN agency to scrape, and the way typically you must scrape them. With a push-based system, you’ll have the danger of causation an excessive amount of knowledge towards your server and primarily crash the server. Prometheus initiates queries to its targets. The entire configuration is completed on the Prometheus server-side and not on the client-side.

  • Inbuilt Alerting facility – Prometheus push alerts to the Alert manager via custom rules outlined in configuration files. From there it’ll send notifications to totally different endpoints like Slack, Google Hangouts, etc. Alert Manager is one of the most elements within the Prometheus scheme. Once they need enough knowledge, we tend to should need to analyze it, visualize it, and send alerts to several members or groups. Thus alerting is one of the vital elements within the observance system.

  • Easy for monitoring teams – Once it’s implemented, it will be very useful for the monitoring teams. They can easily configure different endpoints for alerting.
  • Data visualization

Similarly to Grafana, you can visualize your time series directly in Prometheus Web UI. You can easily filter and have a concrete overview of what’s happening on your different targets.

  • Service discovery – Prometheus can discover your targets dynamically and automatically scrap new targets on demand. Prometheus offers a variety of service discovery options for discovering scrape targets, including Kubernetes, Consul, and many others.

  • Scalability – Prometheus is highly scalable. You can club different Prometheus servers to a single one using the federation approach. You can scrape different Prometheus servers using the “/ federation” endpoint.

  • PromQL – PromQL is a fast simple query language. Prometheus provides a functional query language called PromQL Prometheus Query Language lets the user select and aggregate time-series data in real-time.

Why we should learn Prometheus?

The focus on responsibility is integral by creating every Prometheus server standalone with native time-series info storage to avoid dependence on any remote service. This style makes Prometheus a perfect tool to work on for chop-chop distinguishing problems and obtaining time period feedback on system performance. Exploitation Prometheus, you’ll be able to manage application metrics like outturn (TPS) and reaction times of the author load generator (Kafka producer), author shopper, and prophetess shopper. Node businessperson is often used for checking host hardware and kernel metrics. Since it provisions flat information assortment and information queuing, Prometheus is dependable, permitting shoppers to chop-chop establish issues. Since every server is autonomous, it is often leaned on once another infrastructure is broken, while not exacting further infrastructure.

How does Prometheus work?


Prometheus will be run among longshoreman or Go applications. The watching code may be statistic information with a computer program (UI) and complex, versatile querying language known as PromQL.

Prometheus gathers metrics from instrumented jobs either directly or through an associate intermediator entree designed for temporary jobs. The samples square measure hold on domestically and scanned by rules so as to either collect and record a brand new statistic from the prevailing info or produce alerts. These metrics square measure then displayed by the manner of counters, gauges, and histograms. knowledge is transmitted by HTTP mistreatment plaintext or by additional economical protocols.

Features of Prometheus include:

  • Various modes of graphing and Dashboard support;
  • The prevalence of your time series assortment through a pull model over HTTP;
  • A three-d information model that includes time-series information that’s known with a metric name or with key-value pairs (KVP);
  • The ability to use PromQL to support the multidimensionality of the info model;
  • Autonomous single server nodes and 0 reliance on distributed storage;
  • Discovery of the target through static configuration or service discovery;
  • And the ability to push statistics through AN treater entree.

Uses of Prometheus
IT departments use Prometheus to undertake to catch intrusions and problems in cloud environments as shortly as attainable it’s conjointly wont to gift website, service, and application knowledge and products info that’s relevant to website guests. The tool has been employed by firms like Boxever, Docker, Google, Red Hat, Weaveworks, CoreOs, Ericsson, and DigitalOcean.

Prometheus helps those running cloud-managed services, applications, and sites to confirm correct performance for purchasers apart from the sub-rosa work, Prometheus is vital for customer-facing functions similarly. The package displays relevant knowledge to customers concerning products, sales, reviews, and trends.

Benefits of Prometheus

Prometheus was designed to quickly diagnose issues. It will operate with each machine-centric watching and also the watching of extremely complicated service-oriented architectures. Its sturdy use in four-dimensional information assortment and querying is particularly useful.

Since the Prometheus server is freelance, it doesn’t get to believe remote services like network storage. this suggests it will still be used once alternative components of the infrastructure area unit are bad or broken. moreover, the development of a fancy, massive infrastructure is not sensible for its operation.

Learning Objectives

  • Breakdown and understand the core components of the service
  • Learn how to set up node exporters and a Prometheus monitor
  • Learn the core features of the tool
  • Understand and define the Prometheus monitoring tool

Intended Audience
DevOps engineers, site reliability engineers, and cloud engineers
Anyone looking to up their monitoring expertise with an open-source monitoring tool

Prerequisite(s)
To get the foremost out of this course, you ought to have some familiarity with watching tools. Expertise employing a Terminal, Git, the bash, or Shell would be useful however not essential.

Conclusion

In this course, we have a tendency to take a glance at the Tsar of observation tools – Prometheus is that the second hosted project within the Cloud Native Computing Foundation, right next to the instrumentality orchestrating software package – Kubernetes is an associate degree open-sourced system observation and alerting toolkit with extra capabilities in commission discovery.

If you want to learn relating to this course, I would suggest you visit DevOpsSchool.com.

Thank You!

Tagged : / / / / /

Install and Configure Prometheus Server and Node Exporter in RHEL

Install and Configure Prometheus Server and Node Exporter

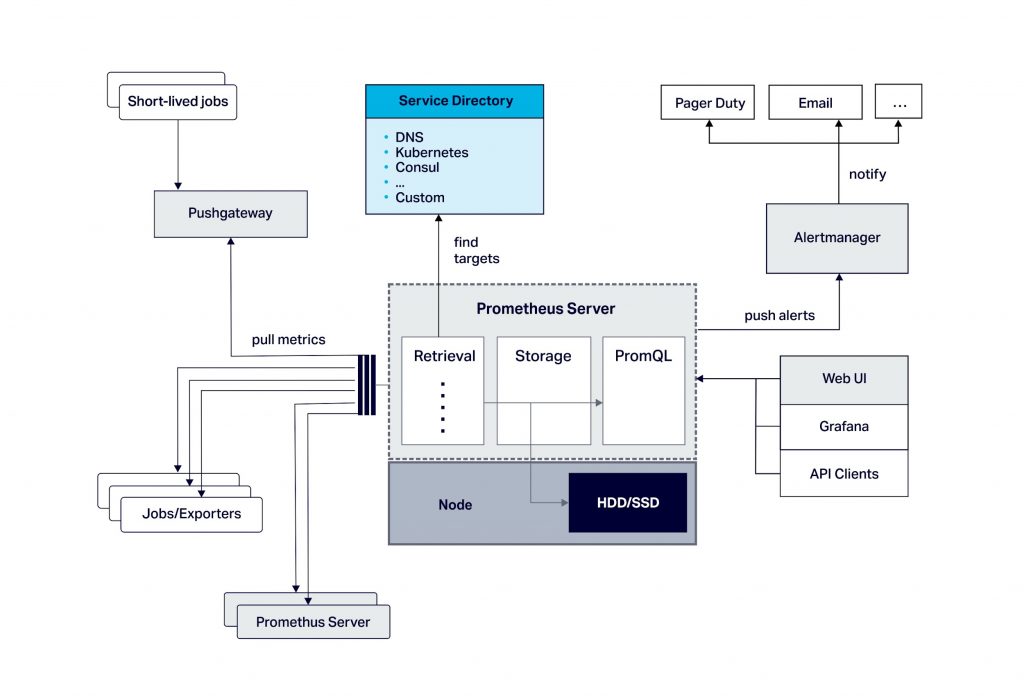
There are 3 importants components to make sure Prometheus is up and running. We need to install and configure

  1. Prometheus Server,
  2. Node Exporter, and
  3. Dashborad which can be PromDash or Grafana.

Step 1 – Install and configure Prometheus Server in RHEL 7

Download Prometheus
Download Prometheus from https://prometheus.io/download/. You can find 3 Prometheus package which is supported for darwin/linux and windows.

$ sudo -s
$ yum install wget -y
$ cd /opt/
$ wget https://github.com/prometheus/prometheus/releases/download/v2.3.2/prometheus-2.3.2.linux-amd64.tar.gz
$ tar -zxvf prometheus-2.3.2.linux-amd64.tar.gz
$ cd prometheus-2.3.2.linux-amd64

If you find following files….

[root@ip-172-31-21-164 prometheus-2.3.2.linux-amd64]# ls -1
LICENSE
NOTICE
console_libraries
consoles
prometheus
prometheus.yml
promtool

This completes the Prometheus installation.

Verify the installation by typing in the following command:

[root@ip-172-31-21-164 prometheus-2.3.2.linux-amd64]# ./prometheus --version
prometheus, version 2.3.2 (branch: HEAD, revision: 71af5e29e815795e9dd14742ee7725682fa14b7b)
build user: root@5258e0bd9cc1
build date: 20180712-14:02:52
go version: go1.10.3

Step 2 – Install and configure Prometheus Node Exporter in RHEL 7

In order to monitor the metrics of your RHEL server, you should install a tool called Node Exporter. Node Exporter, as its name suggests, exports lots of metrics (such as disk I/O statistics, CPU load, memory usage, network statistics, and more) in a format Prometheus understands.

cd /opt/
wget https://github.com/prometheus/node_exporter/releases/download/v0.16.0/node_exporter-0.16.0.linux-amd64.tar.gz
tar -zxvf node_exporter-0.16.0.linux-amd64.tar.gz
cd node_exporter-0.16.0.linux-amd64
nohup ./node_exporter &

Step 3 — Running Node Exporter as a Service
if you want to Running Node Exporter as a Service

$ sudo vi /etc/systemd/system/node_exporter.service

[Unit]
Description=Node Exporter
Wants=network-online.target
After=network-online.target

[Service]
User=root
Group=root
Type=simple
ExecStart=/root/prometheus/node_exporter/node_exporter

[Install]
WantedBy=multi-user.target

# Save the file and exit the text editor.

Reload systemd so that it reads the configuration file you just created.

$ sudo systemctl daemon-reload

Enable it so that it starts automatically at boot time.

$ sudo systemctl enable node_exporter.service

You can now either reboot your server, or use the following command to start the service manually:

$ sudo systemctl start node_exporter.service

Once it starts, use a browser to view Node Exporter’s web interface, which is available at http://your_server_ip:9100/metrics. You should see a page with a lot of text:

Step 4 — Starting Prometheus Server

Enter the directory where you installed the Prometheus server:

$ cd /opt/prometheus-2.3.2.linux-amd64

Before you start Prometheus, you must first understand a configuration file for it called prometheus.yml.

[root@ip-172-31-21-164 prometheus-2.3.2.linux-amd64]# more prometheus.yml
# my global config
global:
scrape_interval: 15s # Set the scrape interval to every 15 seconds. Default is every 1 minute.
evaluation_interval: 15s # Evaluate rules every 15 seconds. The default is every 1 minute.
# scrape_timeout is set to the global default (10s).

# Alertmanager configuration
alerting:
alertmanagers:
- static_configs:
- targets:
# - alertmanager:9093

# Load rules once and periodically evaluate them according to the global 'evaluation_interval'.
rule_files:
# - "first_rules.yml"
# - "second_rules.yml"

# A scrape configuration containing exactly one endpoint to scrape:
# Here it's Prometheus itself.
scrape_configs:
# The job name is added as a label `job=<job_name>` to any timeseries scraped from this config.
- job_name: 'prometheus'

# metrics_path defaults to '/metrics'
# scheme defaults to 'http'.

static_configs:
- targets: ['localhost:9090']

Whereas, This creates a scrape_configs section and defines a job called node. It includes the URL of your Node Exporter’s web interface in its array of targets. The scrape_interval is set to 15 seconds so that Prometheus scrapes the metrics once every fifteen seconds.

You could name your job anything you want, but calling it “node” allows you to use the default console templates of Node Exporter. Save the file and exit.

Start the Prometheus server as a background process.

$ nohup ./prometheus > prometheus.log 2>&1 &

You can view the last few lines of the file using the tail command:

$ tail prometheus.log

Once the server is ready, you will see the following messages in the file:

level=info ts=2018-08-21T11:47:38.56459183Z caller=web.go:415 component=web msg="Start listening for connections" address=0.0.0.0:9090
level=info ts=2018-08-21T11:47:38.569742672Z caller=main.go:543 msg="TSDB started"
level=info ts=2018-08-21T11:47:38.569767659Z caller=main.go:603 msg="Loading configuration file" filename=prometheus.yml
level=info ts=2018-08-21T11:47:38.57069388Z caller=main.go:629 msg="Completed loading of configuration file" filename=prometheus.yml
level=info ts=2018-08-21T11:47:38.570724527Z caller=main.go:502 msg="Server is ready to receive web requests."

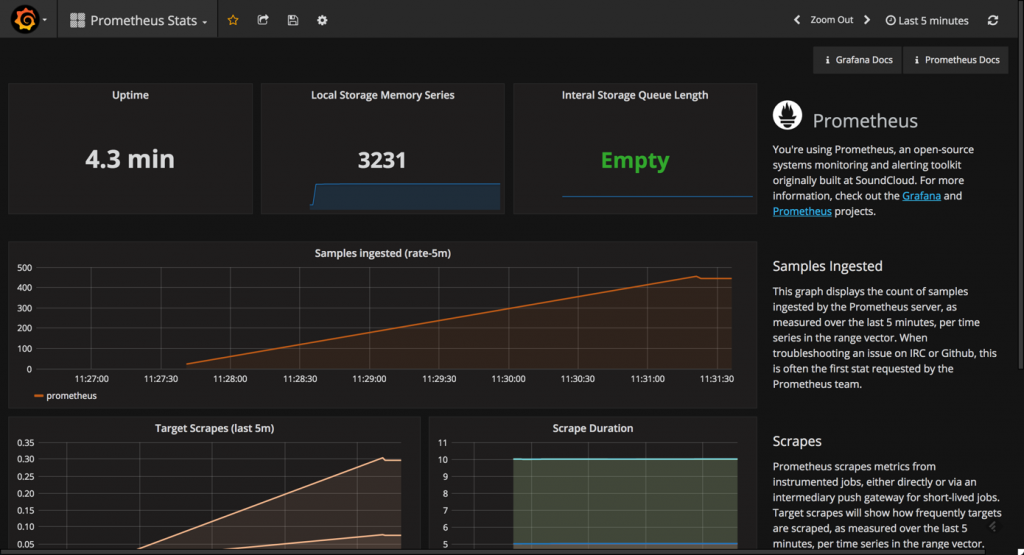
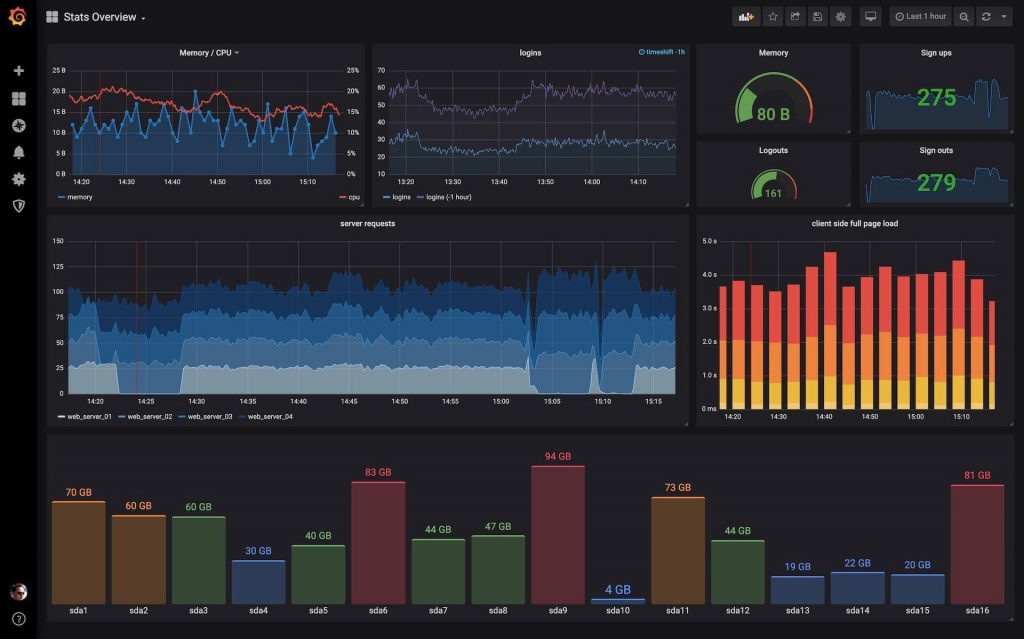
Use a browser to visit Prometheus’s homepage available at http://your_server_ip:9090. You’ll see the following homepage.

Step 5 — Verify Prometheus Server
To make sure that Prometheus server is scraping data from Node Exporter, click on the Graph tab at the top of the page. On the page that opens, type in the name of a metric (like up, for example) in the text field that says Expression. Then, press the blue Execute button. Click Graph (next to Console) just below, and you should see a graph for that metric:

More metric can be found from the Node Exporter host such as
http://X.X.X.X:9100/metrics

Prometheus has console templates that let you view graphs of a few commonly used metrics. These console template are accessible only if you set the value of job_name to “prometheus” in Prometheus’s configuration.

Visit http://your_server_ip:9090/consoles/prometheus.html to access the Node Console and click on your server, localhost:9100, to view its metrics.

Step 6 — Installing PromDash Or Grafana…..

Tagged : / / / / /