Prometheus is an open-source system monitoring and alerting toolkit originally built at SoundCloud. Many companies and organizations have adopted Prometheus and have a very active developer and user community in the project. It is now a standalone open-source project and is maintained independently of any company.
Features of Prometheus:
- A multi-dimensional data model with time series data identified by metric name and key/value pairs.
- PromQL, a flexible query language to leverage this dimensionality.
- No reliance on distributed storage; single server nodes are autonomous.
- Time series collection happens via a pull model over HTTP.
What is Grafana?
Grafana is an open-source solution for running data analytics, understanding large amounts of data, and monitoring our apps with the help of cool customizable dashboards.
What are the benefits of Grafana?
- Customizable dashboards are feature-rich and can be configured to display data from a wide range of databases using visualization tools such as heatmaps, histograms, and charts.
- The platform is flexible and easy to use.
- Native support of a broad range of databases.
Grafana Features:
- Dashboard templating – This is a Grafana feature that is really useful. It allows users to create a dashboard setup to suit their every need.
- Provisioning – It can be simple enough to set up a single dashboard with a few clicks, dragging and dropping, but some users need even more ingenuity this way.
- Annotations – This Grafana feature lets you mark graphs, which is especially helpful when you need to correlate data in case something misbehaves.
- Custom plugins – You can extend the functionality of Grafana with plugins that provide additional tools, visualizations, and more.
- Teams and permissions – Where an organization has an instance of Grafana and multiple teams, they usually prefer to have the option of implementing some dashboard isolation.
Pre-requisites to learn Prometheus and Grafana:
- Basic experience with Linux/Unix system administration.
- Familiarity with common shell commands, such as ls, cd, curl, etc.
- Some knowledge and/or development experience in Go and Python.
- Some experience working with Kubernetes.
How Long Does it Take to Learn Prometheus and Grafana?
Typically, Prometheus and Grafana training by DevOpsSchool will let you master the concepts in about 2 months if you devote 2 to 4 hours per week. The training takes place in such a way that you become proficient in almost all the concepts of Prometheus and Grafana can easily add certification to your resume.
How to Learn Prometheus and Grafana?
The first thing you should do before learning Prometheus and Grafana is to ask yourself how you learn best.
Do you prefer online tutorials, or do you prefer online courses? Do you want to work on projects as part of a team, or are you comfortable learning at your own pace? By considering this question in advance, you will be able to better understand what kind of material you should be looking for.
If you are planning to learn Prometheus and Grafana, go with DevOpsSchool institute. Will provide you online and classroom training and certification course Program by an expert. To get in-depth knowledge of Prometheus and Grafana along with its various applications, check out our interactive, live-online training.
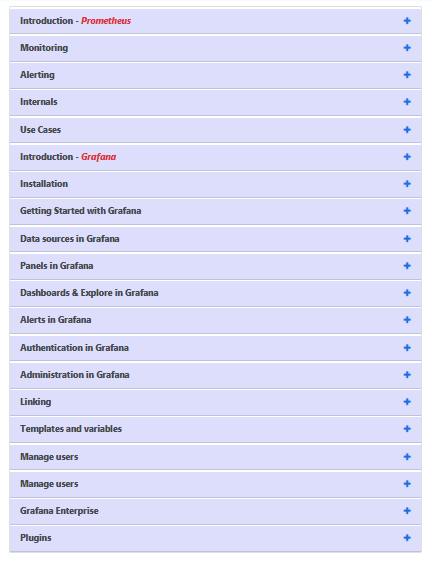
Here you can see the Agenda of Prometheus and Grafana Course:

This course covers the basics of Prometheus and Grafana its main features. You will develop a critical understanding of why Prometheus and Grafana are useful and how they can be combined with other web development frameworks.
You will learn about the basics of Prometheus and Grafana its advantages. Then, you’ll cover more advanced topics like integrating Prometheus and Grafana with other frameworks.
Hopefully, I think this information is helpful for you.
However, if you want to find out more details, be sure to check out our Prometheus and Grafana course to learn more about this technology.


