What is Prometheus & grafana and best course and certification in India?

Prometheus is an open-source system monitoring and alerting toolkit originally built at SoundCloud. Many companies and organizations have adopted Prometheus and have a very active developer and user community in the project. It is now a standalone open-source project and is maintained independently of any company.

Features of Prometheus:

  • A multi-dimensional data model with time series data identified by metric name and key/value pairs.
  • PromQL, a flexible query language to leverage this dimensionality.
  • No reliance on distributed storage; single server nodes are autonomous.
  • Time series collection happens via a pull model over HTTP.

What is Grafana?

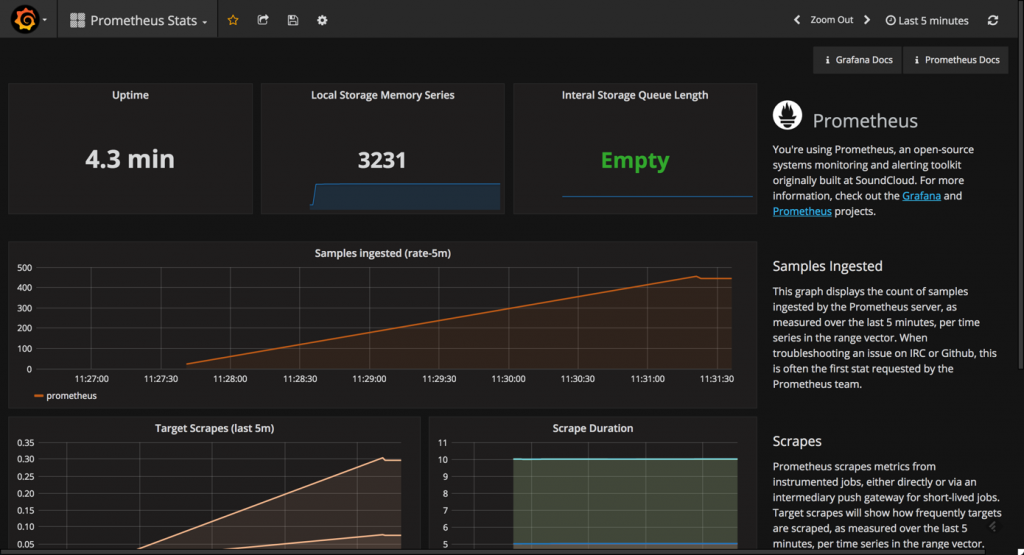
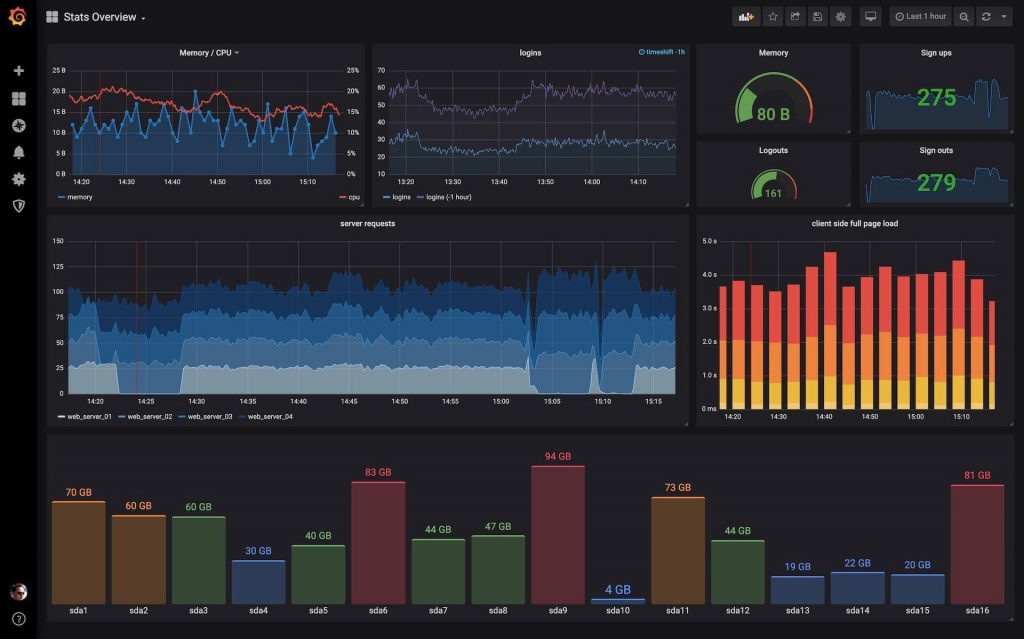
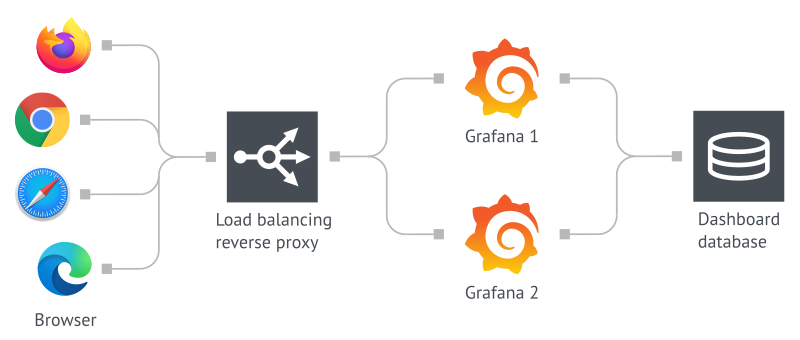
Grafana is an open-source solution for running data analytics, understanding large amounts of data and monitoring our apps with the help of cool customizable dashboards.

What are the benefits of Grafana?

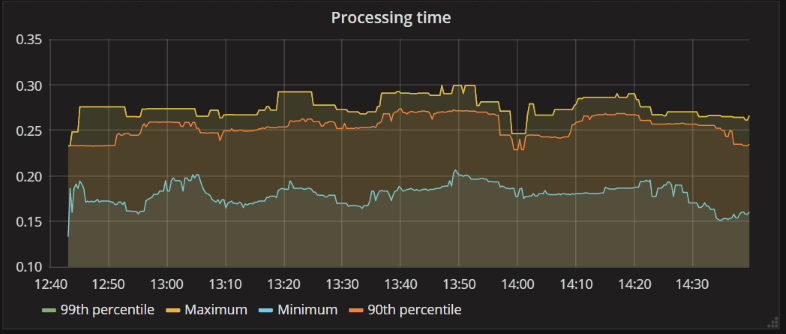
  • Customizable dashboards are feature-rich and can be configured to display data from a wide range of databases using visualization tools such as heatmaps, histograms, and charts.
  • The platform is flexible and easy to use.
  • Native support of a broad range of databases.

Grafana Features:

  • Dashboard templating – This is a Grafana feature that is really useful. It allows users to create a dashboard setup to suit their every need.
  • Provisioning – It can be simple enough to set up a single dashboard with a few clicks, dragging and dropping, but some users need even more ingenuity this way.
  • Annotations – This Grafana feature lets you mark graphs, which is especially helpful when you need to correlate data in case something misbehaves.
  • Custom plugins – You can extend the functionality of Grafana with plugins that provide additional tools, visualizations, and more.
  • Teams and permissions – Where an organization has an instance of Grafana and multiple teams, they usually prefer to have the option of implementing some dashboard isolation.

Pre-requisites to learn Prometheus and Grafana:

  • Basic experience with Linux/Unix system administration.
  • Familiarity with common shell commands, such as ls, cd, curl, etc.
  • Some knowledge and/or development experience in Go and Python.
  • Some experience working with Kubernetes.

If you are planning to learn Prometheus and Grafana, go with DevOpsSchool institute. Will provide you online and classroom training and certification course Program by an expert. To get in-depth knowledge of Prometheus and Grafana along with its various applications, check out our interactive, live-online training.

Here you can see the Agenda of Prometheus and Grafana Course:

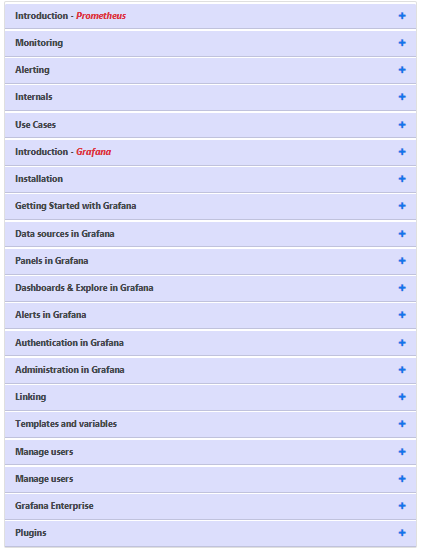
This course covers the basics of Prometheus and Grafana and their main features. You will develop a critical understanding of why Prometheus and Grafana are useful and how they can be combined with other web development frameworks.

You will learn about the basics of Prometheus and Grafana and their advantages. Then, you’ll cover more advanced topics like integrating Prometheus and Grafana with other frameworks.

Hopefully, I think this information is helpful for you.

However, if you want to find out more details, be sure to check out our Prometheus and Grafana course to learn more about this technology.

Tagged : / / / / /

Complete guide of Prometheus with Grafana Certification courses, tutorials, and training

Tutorial
Prometheus is an associate open provide systems observance system that Grafana provides out-of-the-box support. this subject walks you through the steps to create a series of dashboards in Grafana to indicate system metrics for a server monitored by Prometheus.

What is Prometheus with Grafana?

Prometheus could be an observance answer for storing time-series knowledge like metrics. Grafana permits visualizing the information keep in Prometheus and different sources. This sample demonstrates the way to capture NServiceBus metrics, storing these in Prometheus and visualizing these metrics victimization Grafana.

Why do we need Prometheus with Grafana?

The combination of OSS grafana and Prometheus is turning into an additional and additional common observation stack utilized by DevOps groups for storing and visualizing statistic information. Prometheus acts because of the storage backend and open supply grafana because of the interface for analysis and visual image.

How does Prometheus work with Grafana?

Prometheus acts because of the storage backend and open supply grafana because of the interface for analysis and visual image. Prometheus collects metrics from monitored targets by scraping metrics from HTTP endpoints on these targets. handily, Prometheus exposes a large sort of metrics that will be simply monitored.

Key Features of Grafana and Prometheus

Key features of Grafana include-

  • Alert systems.
  • Unifies your data.
  • Dashboard sharing.

Prometheus excels in features like-

  • Provides time series data.
  • Flexible query language, PromQL allows users to select data in real-time.
  • Multi-dimensional data model.

Key Strengths of the Grafana and Prometheus

Following are the key strengths of Grafana-

  • Analytics and monitoring tool.
  • Visualizing system CPU, memory, I/O utilization metrics.
  • Creating custom dashboards.
  • Integration with tools like Prometheus, Graphite, InfluxDB, MySQL.

Below mentioned are the key strengths for Prometheus-

  • Supports machine-centric and service-oriented architecture monitoring.
  • Availability of viewing statistics of a system.
  • Efficient storage.

Prometheus and Grafana Training and Certification

Prometheus is in style open-source observance and alerting tool with attention to dependableness and ease. The computer code was developed as a result of the requirement to observe varied microservices that may be running in your system. Prometheus is written within the Go language, and it ships with simply divided binaries that one will use to urge it to run as quickly as attainable.

DevOpsSchool places each leap forward to instruct participants from basic to Advance level courses of Prometheus. we’ve got well-experienced trainers and Instructors United Nations agency hold recognition within the IT business. Our mentors offer support to candidates whereas learning and thru coaching.

Agenda of the Prometheus with Grafana

About the course: Prometheus with Grafana

Our instructor-led Prometheus and Grafana coaching course can enable you to explore and learn to form observability solutions to observe and visualize the performance and health standing of your distributed systems, apps, and containerized clusters.

Practical active exercises can offer you the talents to place in situ effective metrics, dashboards, and alerts therefore you’ll be able to make sure the performance and strength of the platforms you support like Docker, Kubernetes, and more.

This course is out there as a part of a wider educational program or as a customizable standalone workshop – seek advice from us concerning however we will tailor your coaching to suit in together with your existing skills, your current school stack, and your learning goals.

Through custom coaching, we will show you how to install, assemble and deploy Prometheus and/or Grafana to live the performance and health of platforms as well as Kubernetes, Docker, Puppet, Spring Boot, Node …the list is large.

Conclusion

We have seen that Grafana provides a seamless thanks to connecting with the Prometheus knowledge supply and it provides nice visualization through queries. attempt it out mistreatment the DevOpsSchool, where you’ll be able to use Grafana right in our internet platform. Also, book a demo and consult with us directly. We’re forever happy to speak regarding your company’s observance wants.

Thank you!

Tagged : / / / / / /

Everything you need to know about Grafana

What is Grafana?

Grafana is multi-platform open-source analytics and interactive visualization internet application. It provides charts, graphs, and alerts for the online once connected to supported knowledge sources.

Why is Grafana important?

Grafana shows groups and corporations what their users very do, not simply what they are saying they are doing. These square measures are called discovered behaviors, and they are extremely telling. Users aren’t terribly adept at predicting their own futures and having analytics permits technical school groups to dig deeper than human-error-prone surveys and watching.

How does Grafana work?

A Grafana dashboard supports multiple panels in a passing single grid, you may visualize results from multiple data sources at an equivalent time. It’s a strong open source analytical and visual image tool that consists of multiple individual panels organized in an exceeding grid.

Benefits of Grafana:

  • Grafana Cloud Traces.
  • Grafana Cloud Metrics.
  • Superfast Prometheus- and Grefait- compatible backend.
  • Grafana Cloud Dashboards. Dedicated Grafana front-end with enhanced reporting, security, management, and more.
  • Grafana Cloud Logs. Based on Grafana Loki, extreme scale, efficiency, and speed.

Where is Grafana used?

Companies use Grafana to observe their infrastructure and log analytics, preponderantly to enhance their operational potency. Dashboards build trailing users and events straightforward as a result of it automates the gathering, management, and viewing of knowledge.

What features does Grafana provide?

The tools that groups really used to uncover insights vary from organization to organization. The following area unit the foremost common (and useful) choices they might expect of data analytics/the visual image tools like Grafana.

Common Grafana features:

  • Visualize: Grafana has a plethora of visualization options to help you understand your data from graphs to histograms, you have it all.
  • Alerts: Grafana lets you define thresholds visually, and get notified via Slack, PagerDuty, and more
  • Unify: You can bring your data together to get better context. Grafana supports dozens of databases, natively.
  • Open-Source: It’s completely open-source. You can use Grafana Cloud, or easily install it on any platform.
  • Explore Logs: Using label filters you can quickly filter and search through the laundry list of logs.
  • Display dashboards: Visualize data with templated or custom reports. Create and share reports.
  • Create and Share reports: Create and share reports with your customers and stakeholders. This feature is not available in the open-source version.

Why do companies use Grafana?

Companies use Grafana to watch their infrastructure and log analytics, preponderantly to boost their operational potency. Dashboards build chase users and events straightforward as a result of it automates the gathering, management, and viewing of knowledge. Product leaders, security analysts, and developers use this knowledge to guide their selections. Studies show that corporations that consider information analytics and mental image tools like the Grafana the area unit are way more profitable than their peers.

Learning Objectives

  • Explore metrics and logs
  • Build dashboards
  • Annotate dashboards
  • Set up alerts

Intended Audience

Centralize the analysis, visualization, and alerting for all of your data with Grafana. Install, administer, and maintain your own instance

Prerequisites

Grafana requires a database to store its configuration data, such as users, data sources, and dashboards…

  • MySQL.
  • PostgreSQL
  • SQLite.
  • Supported databases

Conclusion

Grafana permits groups across Stack Overflow to quickly and simply build the custom self-service dashboards for what is vital to them, regardless of wherever the info lives or that info it’s holding on to.

If you want to learn relating to this course, I would suggest you visit DevOpsSchool.com.

Thank you!

Tagged : / / / /

Install and Configure Grafana in Ubuntu and Debian

Install and Configure Grafana in Ubuntu and Debian

Step 1 – Download & Install Grafana
Download Grafana RPM file RPM for Linux from https://grafana.com/grafana/download?platform=linux

# Ubuntu & Debian
$ wget https://s3-us-west-2.amazonaws.com/grafana-releases/release/grafana_5.2.2_amd64.deb
$ sudo dpkg -i grafana_5.2.2_amd64.deb

Step 2 – Understand Grafana Installation details in Ubuntu/Debian

  1. Installs binary to /usr/sbin/grafana-server
  2. Installs Init.d script to /etc/init.d/grafana-server
  3. Creates default file (environment vars) to /etc/default/grafana-server
  4. Installs configuration file to /etc/grafana/grafana.ini
  5. Installs systemd service (if systemd is available) name grafana-server.service
  6. The default configuration sets the log file at /var/log/grafana/grafana.log
  7. The default configuration specifies an sqlite3 db at /var/lib/grafana/grafana.db
  8. Installs HTML/JS/CSS and other Grafana files at /usr/share/grafana

Step 3 – Start the server (init.d service)

$ sudo service grafana-server start

This will start the grafana-server process as the grafana user, which was created during the package installation. The default HTTP port is 3000 and default user and group is admin.

Step 4 – Configure the Grafana server to start at boot time

$ sudo update-rc.d grafana-server defaults
$ systemctl daemon-reload
$ systemctl start grafana-server
$ systemctl status grafana-server
$ sudo systemctl enable grafana-server.service

Step 5 – Grafana server Environment file
The systemd service file and init.d script both use the file located at /etc/default/grafana-server for environment variables used when starting the back-end. Here you can override log directory, data directory and other variables.

Step 6 – Grafana server Log
By default Grafana will log to /var/log/grafana

Step 7 – Grafana Database
The default configuration specifies a sqlite3 database located at /var/lib/grafana/grafana.db.

You can also use MySQL or Postgres as the Grafana database, as detailed on
http://docs.grafana.org/installation/configuration/#database

Step 7 – Grafana configuration
The configuration file is located at /etc/grafana/grafana.ini. Go the Configuration page for details on all those options. You can add following data sources

  1. Graphite
  2. InfluxDB
  3. OpenTSDB
  4. Prometheus

Step 8 – Server side image rendering
Server side image (png) rendering is a feature that is optional but very useful when sharing visualizations, for example in alert notifications.

$ yum install fontconfig
$ yum install freetype*
$ yum install urw-fonts

Step 9 – How to access the Grafana dashboard

http://13.232.27.156:3000/
User name – admin
Password – admin

Tagged : / / / /

Install and Configure Grafana in RHEL 7

Install and Configure Grafana in RHEL 7

Step 1 – Download & Install Grafana
Download Grafana RPM file RPM for Linux from https://grafana.com/grafana/download?platform=linux

# RHEL 7

$ sudo yum install initscripts fontconfig -y
$ wget https://s3-us-west-2.amazonaws.com/grafana-releases/release/grafana-5.2.2-1.x86_64.rpm
$ sudo yum localinstall grafana-5.2.2-1.x86_64.rpm

Step 2 – Understand Grafana Installation details in RHEL/CENTOS

  1. Installs binary to /usr/sbin/grafana-server
  2. Copies init.d script to /etc/init.d/grafana-server
  3. Installs default file (environment vars) to /etc/sysconfig/grafana-server
  4. Copies configuration file to /etc/grafana/grafana.ini
  5. Installs systemd service (if systemd is available) name grafana-server.service
  6. The default configuration uses a log file at /var/log/grafana/grafana.log
  7. The default configuration specifies an sqlite3 database at /var/lib/grafana/grafana.db

Step 3 – Start the server (init.d service)

$ sudo service grafana-server start

This will start the grafana-server process as the grafana user, which is created during package installation. The default HTTP port is 3000, and default user and group is admin.

Step 4 – Configure the Grafana server to start at boot time

$ sudo /sbin/chkconfig --add grafana-server
$ sudo systemctl enable grafana-server.service
$ systemctl daemon-reload
$ systemctl start grafana-server
$ systemctl status grafana-server

Step 5 – Grafana server Environment file
The systemd service file and init.d script both use the file located at /etc/sysconfig/grafana-server for environment variables used when starting the back-end. Here you can override log directory, data directory and other variables.

Step 6 – Grafana server Log
By default Grafana will log to /var/log/grafana

Step 7 – Grafana Database
The default configuration specifies a sqlite3 database located at /var/lib/grafana/grafana.db. Please backup this database before upgrades.

You can also use MySQL or Postgres as the Grafana database, as detailed on
http://docs.grafana.org/installation/configuration/#database

Step 8 – Grafana configuration
The configuration file is located at /etc/grafana/grafana.ini. Go the Configuration page for details on all those options. You can add following data sources

  1. Graphite
  2. InfluxDB
  3. OpenTSDB
  4. Prometheus

Step 9 – Server side image rendering
Server side image (png) rendering is a feature that is optional but very useful when sharing visualizations, for example in alert notifications.

$ sudo yum install fontconfig -y
$ sudo yum install freetype* -y
$ sudo yum install urw-fonts -y


Step 10 – Browse the dashboard
http://X.X.X.X.:3000/
Username – admin
Password – admin

Tagged : / / / / /