Introduction
In the modern finance function, data isn’t just numbers on a spreadsheet—it’s the lifeblood of strategic decision-making. Business Intelligence (BI) for Finance refers to specialized software and platforms that transform raw financial and operational data into interactive, visual insights. These tools move finance teams beyond static monthly reports, enabling real-time analysis, forecasting, and data-driven storytelling that guides the entire company.
The importance of financial BI cannot be overstated. It elevates the finance team from a historical record-keeper to a forward-looking strategic partner. By automating data consolidation from ERPs, CRMs, and other systems, these tools save hundreds of hours, drastically reduce manual errors, and provide a single source of truth for financial performance. They empower stakeholders across the organization to self-serve answers, freeing up finance professionals for high-value analysis.
Key real-world use cases include:
- Automated financial reporting & dashboards: Replacing manual Excel-based P&L, balance sheet, and cash flow statement generation with live, interactive versions.
- FP&A (Financial Planning & Analysis): Creating dynamic, driver-based budgets, forecasts, and scenario models that can be updated in real-time.
- Profitability analysis: Drilling down into product, customer, or region-level profitability to identify growth opportunities and cost drains.
- Operational KPI tracking: Visualizing key metrics like CAC (Customer Acquisition Cost), LTV (Lifetime Value), burn rate, and AR/AP days in executive dashboards.
- Compliance & audit reporting: Generating standardized, accurate reports for auditors, regulators, and the board with a clear audit trail.
When evaluating financial BI tools, key criteria are: robust data connectivity (to your specific ERP, GL, and data sources), strong financial modeling capabilities, granular security and access controls, collaboration features for the planning process, and scalability to handle increasing data volume and user complexity.
Best for: These tools deliver transformative value to Financial Analysts, FP&A Managers, CFOs, Controllers, and Accounting teams in mid-market to enterprise-level companies (typically 50+ employees). Industries with complex financials, high transaction volumes, or multiple data sources—such as SaaS, technology, manufacturing, retail, and professional services—benefit immensely.
Not ideal for: Very small businesses or sole proprietors with simple, straightforward finances that can be managed entirely within a capable accounting platform (like QuickBooks Online or Xero) may not need a separate BI layer. Startups pre-revenue or with a single funding round might also find the cost and implementation overhead premature until their financial model becomes more complex.
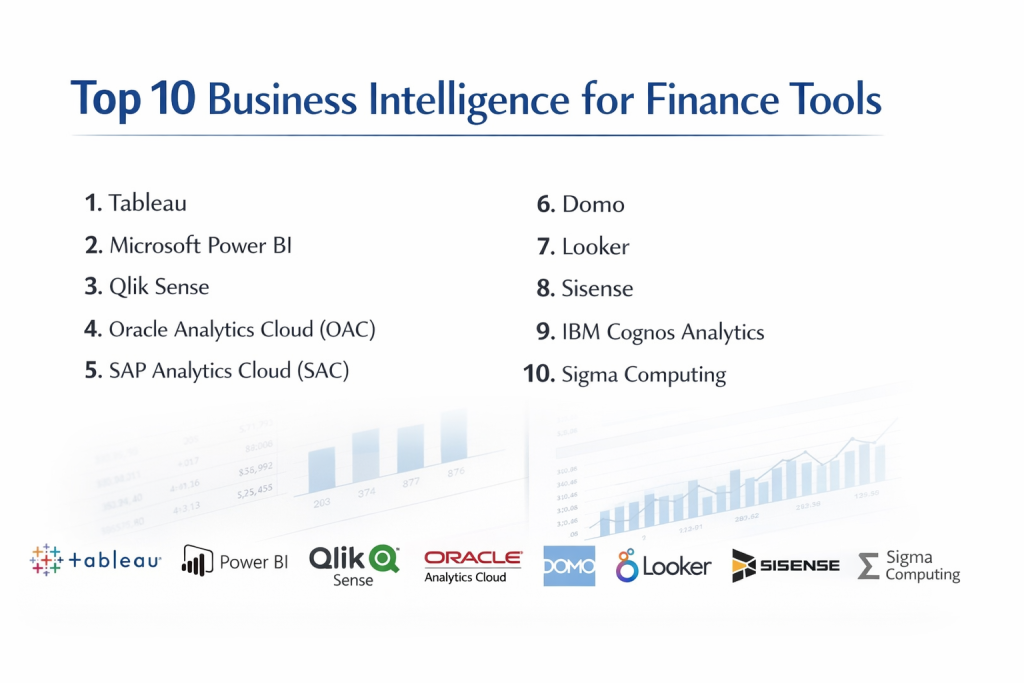
Top 10 Business Intelligence for Finance Tools
1 — Tableau
Tableau is a market-leading visual analytics platform renowned for its powerful, drag-and-drop interface that creates highly interactive and customizable data visualizations. It’s favored by finance teams that need to explore complex datasets and build compelling, boardroom-ready data stories.
Key features:
- Intuitive drag-and-drop interface for creating complex charts, graphs, and dashboards without coding.
- “Ask Data” natural language querying to get answers by typing questions.
- Advanced calculations and statistical modeling (LOD expressions, trend lines, forecasting).
- Strong data blending capabilities to combine disparate data sources (ERP, CRM, spreadsheets).
- Tableau Prep for visually cleaning, shaping, and automating data workflows.
- Extensive public gallery and community for template inspiration and shared solutions.
Pros:
- Unmatched depth and flexibility in data visualization, allowing for highly tailored, insightful dashboards.
- Empowers deep, ad-hoc data exploration by analysts to discover insights beyond standard reports.
Cons:
- Can have a steep learning curve to master its full analytical power, especially for non-technical users.
- Cost can be high, particularly for enterprise-wide deployments with many creators.
Security & compliance: SOC 2, ISO 27001, GDPR compliant. Offers robust row-level security (RLS), SSO, and encryption.
Support & community: Vast online community (Tableau Public, forums), extensive knowledge base, and paid tiers with premium support and training.
2 — Microsoft Power BI
Power BI is a comprehensive, integrated suite of business analytics tools that connects to a vast array of data sources. Its deep integration with the Microsoft ecosystem (Excel, Azure, SQL Server) makes it a dominant choice for organizations already invested in Microsoft.
Key features:
- Seamless integration with Microsoft 365, Excel, Azure Data Services, and Dynamics 365.
- Power Query and DAX language for powerful data transformation and sophisticated financial modeling.
- AI-powered insights with Quick Insights and integration with Azure Machine Learning.
- Strong collaboration through shared workspaces, apps, and natural integration with Teams and SharePoint.
- Paginated reports for pixel-perfect, printable financial statements.
- Highly competitive pricing, especially with existing Microsoft licensing.
Pros:
- Exceptional value and lower total cost of ownership for Microsoft-centric organizations.
- From casual user to pro-developer scale, with tools from Power BI Desktop to the embedded analytics API.
Cons:
- DAX formula language has a significant learning curve for complex modeling.
- Visual customization and aesthetic design can feel less polished than best-in-class competitors.
Security & compliance: Compliant with global standards (SOC 1/2, ISO, GDPR). Granular security via Azure Active Directory, row-level security, and data loss prevention policies.
Support & community: Massive global community, Microsoft documentation, and support plans. Strong presence on forums and learning platforms.
3 — Qlik Sense
Qlik Sense is an associative analytics engine that promotes exploration and discovery. Its unique in-memory data model allows users to freely explore all data connections without being limited by pre-defined queries or paths.
Key features:
- Associative engine that indexes all data relationships, enabling intuitive free-form exploration.
- Powerful AI and machine learning (Qlik Insight Bot) for automated insight generation and natural language interaction.
- Centralized data management with Qlik Data Manager for creating governed, reusable data models.
- Self-service visualization and dashboard creation with drag-and-drop simplicity.
- Strong scripting language (Qlik Script) for complex data loading and transformation.
- Responsive design for dashboards that work on any device.
Pros:
- Superior data discovery experience that helps users uncover non-obvious relationships and insights.
- Scalable and governed self-service, balancing user freedom with IT control over data sources.
Cons:
- Conceptual model is different from traditional query-based BI, requiring a mindset shift.
- Can be resource-intensive (in-memory) and has a higher price point than some competitors.
Security & compliance: SOC 2, ISO 27001, GDPR compliant. Features section access for row-level security, SSO, and detailed audit logging.
Support & community: Qlik Community is very active, with continuous learning resources, master classes, and user groups.
4 — Oracle Analytics Cloud (OAC)
Oracle Analytics Cloud is an end-to-end, integrated platform offering machine learning-infused analytics across data preparation, visualization, enterprise reporting, and predictive analysis. It is a natural, powerful fit for organizations running Oracle E-Business Suite, NetSuite, or Fusion ERP.
Key features:
- Native, optimized connectivity to Oracle ERP, HCM, SCM, and NetSuite cloud applications.
- Augmented analytics with Explain (automatic insight detection) and natural language processing/generation.
- Comprehensive platform covering self-service visualization, enterprise reporting (BI Publisher), and data preparation.
- Built-in machine learning for forecasting, clustering, and anomaly detection directly within the workflow.
- Data lake and warehouse integrations with Oracle Autonomous Data Warehouse.
- Mobile-optimized for analytics on the go.
Pros:
- Best-in-class integration and performance for Oracle ecosystem customers, simplifying architecture.
- True augmented analytics features are deeply embedded and accessible to business users.
Cons:
- Can be complex and costly, especially for non-Oracle shops.
- The breadth of the suite can be overwhelming for teams seeking a simple visualization tool.
Security & compliance: Meets Oracle’s stringent global cloud security standards (SOC, ISO, etc.). Deep integration with Oracle Identity Cloud Service for governance.
Support & community: Enterprise-grade support from Oracle, extensive documentation, and Oracle user groups (OAUG).
5 — SAP Analytics Cloud (SAC)
SAP Analytics Cloud is SAP’s flagship, cloud-native BI and planning solution. It uniquely unifies business intelligence, augmented and predictive analytics, and enterprise planning in a single product, designed to be the analytics layer for the “intelligent enterprise.”
Key features:
- Unified BI, planning, and predictive in one interface, allowing “planning on the fly” from live data.
- Native, live connectivity to SAP S/4HANA, SAP BW/4HANA, and other SAP sources.
- Smart Predict for automated time-series forecasting, classification, and regression without coding.
- Collaborative enterprise planning with workflow, commentary, and data entry schedules.
- Search to Insight natural language querying and smart story creation.
- Digital boardroom for creating immersive, presentation-style executive dashboards.
Pros:
- Industry-leading integration with SAP ERP data, offering real-time analytics on transactional data.
- Powerful, native integration of planning and analytics breaks down silos between FP&A and BI.
Cons:
- Primarily optimized for the SAP ecosystem; less compelling for non-SAP environments.
- Licensing and implementation can be complex and enterprise-focused.
Security & compliance: Enterprise-grade security certified (ISO, SOC, etc.). Integrated with SAP Cloud Identity and Access Governance.
Support & community: SAP support networks, extensive help portal, and a large ecosystem of SAP partners.
6 — Domo
Domo is a cloud-native BI platform built for the entire business, with a particular strength in real-time data. It connects to hundreds of cloud and on-premise data sources and presents data in an intuitive, card-based dashboard interface.
Key features:
- Vast library of pre-built cloud connectors (Snowflake, Salesforce, Google Analytics, etc.) for rapid setup.
- Real-time data alerts and notifications sent via email, mobile, or Slack when metrics hit thresholds.
- Buzz collaboration tool for contextual discussions tied directly to data cards and dashboards.
- Magic ETL for visual data transformation and pipeline building.
- Fully managed cloud service with minimal IT overhead for infrastructure.
- Strong mobile application with a native feel.
Pros:
- Unparalleled ease and speed of connecting to diverse cloud data sources.
- Excellent real-time capabilities and alerting for operational and financial KPIs.
Cons:
- Pricing is often cited as premium and can be opaque, based on a “card” and user model.
- Less focused on deep, pixel-perfect financial reporting compared to some enterprise stalwarts.
Security & compliance: SOC 1, 2, 3, ISO 27001, GDPR compliant. Features include SSO, granular data permissions, and audit trails.
Support & community: 24/7 customer support, Domo University for training, and an active community (Dojo).
7 — Looker (part of Google Cloud)
Looker is a modern BI platform built on a semantic “LookML” modeling layer. This unique approach centralizes business logic and definitions, ensuring consistency and governance while enabling self-service exploration on trusted data.
Key features:
- LookML modeling layer where analysts define metrics and dimensions in code, creating a single source of truth.
- Deep integration with Google Cloud Platform (BigQuery, Cloud SQL) and modern data warehouses.
- “Powered by Looker” embedded analytics to infuse data experiences into other applications.
- In-database architecture leverages the power of modern cloud data warehouses for performance.
- API-first design for extensive customization and workflow integration.
- Reusable Explores for consistent self-service analysis.
Pros:
- Unrivaled governance and consistency through its centralized semantic model (LookML).
- Ideal for data-mature organizations using cloud data warehouses (BigQuery, Snowflake, Redshift).
Cons:
- Requires specialized “LookML Developer” skills to build and maintain the data model.
- Less oriented toward traditional, spreadsheet-style financial reporting out-of-the-box.
Security & compliance: SOC 2, ISO 27001 compliant. Integrates with Google Cloud IAM for access control and supports SSO.
Support & community: Looker community portal, comprehensive documentation, and support via Google Cloud.
8 — Sisense
Sisense is a highly scalable BI platform known for its ability to handle large, complex datasets from multiple sources with high performance. Its “In-Chip” technology and single-stack architecture are designed to simplify complex data preparation and analysis.
Key features:
- Single-stack, high-performance architecture (In-Chip technology) for querying large, complex datasets.
- Elasticube data modeling for building blended, analysis-ready data models.
- Highly customizable, pixel-perfect dashboards and white-labeling for embedded analytics.
- AI-driven insights and natural language querying via Sisense Q.
- Extensive APIs for embedding analytics into applications, portals, and workflows.
- Support for both cloud and on-premise deployments.
Pros:
- Handles very large and complex data models with strong performance, ideal for intricate financial consolidations.
- Powerful embedded analytics capabilities for finance teams building data products for other departments.
Cons:
- Can be complex to set up and optimize for maximum performance.
- Pricing and packaging may be more suited to larger, embedded-use-case deployments.
Security & compliance: SOC 2, ISO 27001, GDPR, HIPAA compliant. Offers granular security, SSO, and audit capabilities.
Support & community: Sisense Academy, community forums, and standard enterprise support channels.
9 — IBM Cognos Analytics
IBM Cognos Analytics is an enterprise-grade, AI-fueled business intelligence suite with deep capabilities in reporting, dashboarding, and data exploration. It’s built for large organizations requiring robust governance, scalable deployments, and advanced multidimensional analysis.
Key features:
- Comprehensive suite covering interactive dashboards, managed enterprise reporting, and ad-hoc query.
- AI assistance for automated data preparation, pattern detection, and natural language narration of insights.
- Strong financial reporting capabilities for complex, book-quality financial statements.
- Integrated planning module (Cognos Planning) for corporate performance management (CPM).
- Modeling and framework manager for creating robust, governed business metadata layers.
- Scalable deployment options on-cloud, on-premise, or hybrid.
Pros:
- Trusted, enterprise-strength platform for complex, regulated reporting environments.
- Strong AI integration throughout the workflow, from data prep to storytelling.
Cons:
- User interface can feel less modern and intuitive than newer cloud-native competitors.
- Perceived as a heavier, more IT-centric solution requiring significant administration.
Security & compliance: Meets high enterprise standards (SOC, ISO). Deep integration with IBM Security services for access management and data protection.
Support & community: IBM support, extensive documentation, and a long-established user community.
10 — Sigma Computing
Sigma is a cloud-native BI and analytics tool that uses a familiar spreadsheet-like interface to provide live, direct access to cloud data warehouses. It empowers finance users who think in spreadsheets to analyze billion-row datasets without moving the data or requiring SQL.
Key features:
- Spreadsheet-like interface that feels familiar to finance professionals, reducing the learning curve.
- Live connection to cloud data warehouses (Snowflake, BigQuery, Redshift) – no data extracts.
- Combines the flexibility of a spreadsheet with the governance, security, and scale of the data warehouse.
- Collaborative workbook environment with built-in commenting and workflow.
- Easy creation of calculations and aggregations using plain language or formula-based approaches.
- Built for ad-hoc analysis and exploration on the full, fresh dataset.
Pros:
- Revolutionary ease of adoption for Excel-power users in finance, unlocking self-service on governed data.
- Eliminates the risks of stale data extracts by working directly on the live data source.
Cons:
- Best suited for organizations already using a modern cloud data warehouse.
- Less focused on building formal, production-style dashboards compared to traditional BI tools.
Security & compliance: SOC 2 Type II certified. Leverages the security of the underlying cloud data warehouse and provides its own access controls.
Support & community: Sigma University, community Slack channel, and standard enterprise support.
Comparison Table
| Tool Name | Best For | Platform(s) Supported | Standout Feature | Rating |
|---|---|---|---|---|
| Tableau | Deep data exploration & world-class visual storytelling | Web, Desktop, Mobile | Unmatched flexibility & power in data visualization | N/A |
| Microsoft Power BI | Microsoft-centric organizations seeking value & integration | Web, Desktop, Mobile | Deep Excel/Teams integration & low-cost entry point | N/A |
| Qlik Sense | Guided data discovery & uncovering hidden relationships | Web, Mobile | Associative data engine for free-form exploration | N/A |
| Oracle Analytics Cloud | Companies deeply invested in the Oracle application stack | Web, Mobile | Native, augmented analytics for Oracle ERP data | N/A |
| SAP Analytics Cloud | SAP S/4HANA or BW customers needing unified BI & planning | Web, Mobile | Native live connectivity to SAP & integrated planning | N/A |
| Domo | Real-time KPI monitoring & connecting many cloud apps | Web, Mobile | Vast pre-built connectors & real-time alerts | N/A |
| Looker | Data-mature firms using cloud warehouses & needing governance | Web, Embedded | “LookML” semantic layer for centralized business logic | N/A |
| Sisense | Complex data models, large scale, & embedded analytics | Web, Mobile, Embedded | High-performance engine for large, blended datasets | N/A |
| IBM Cognos Analytics | Large enterprises with complex, governed reporting needs | Web, On-Prem | Enterprise-strength reporting & AI-assisted insights | N/A |
| Sigma Computing | Finance teams who live in spreadsheets & use cloud warehouses | Web | Spreadsheet UI for direct querying of live cloud data | N/A |
Evaluation & Scoring of Business Intelligence for Finance
Use this weighted rubric to score potential tools (1-5 scale, where 5 is excellent). Multiply each score by the weight to get a category score, then sum for a total score out of 5.
| Evaluation Criteria | Weight | What to Look For (Score 1-5) | Your Score x Weight |
|---|---|---|---|
| Core Features | 25% | Financial reporting, dashboards, ad-hoc analysis, forecasting, modeling, planning. | |
| Ease of Use | 15% | Intuitive for finance users (analysts & consumers), learning curve, self-service capability. | |
| Integrations & Ecosystem | 15% | Native connectors to your ERP (NetSuite, Sage, SAP), GL, CRM, data warehouse, Excel. | |
| Security & Compliance | 10% | SOC 2, row-level security (critical for finance), audit trails, data encryption, SSO. | |
| Performance & Reliability | 10% | Speed with your data volume, uptime, refresh schedules, handling of complex calculations. | |
| Support & Community | 10% | Finance-specific expertise, quality of onboarding/training, community resources, SLAs. | |
| Price / Value | 15% | Transparent pricing model, scalability, ROI based on time saved and insight quality. | |
| TOTAL SCORE | 100% | /5 |
Which Business Intelligence for Finance Tool Is Right for You?
- Solo Users vs. SMB vs. Mid-Market vs. Enterprise: Solo analysts or SMBs should prioritize ease and cost (Power BI Pro, Tableau Creator). Mid-Market companies need balance and scalability (Tableau, Qlik Sense, Domo). Large Enterprises require governance, deep ERP integration, and scalability (SAP SAC, Oracle OAC, IBM Cognos).
- Budget-Conscious vs. Premium Solutions: For tight budgets, Power BI is the clear value leader. Mid-tier solutions like Qlik Sense and Tableau offer strong ROI. Premium/Enterprise solutions (SAP, Oracle, Looker) justify cost with deep system integration and advanced features.
- Feature Depth vs. Ease of Use: If you have complex modeling, regulatory reporting, or embedded needs, prioritize depth (Sisense, IBM Cognos). If user adoption and speed-to-insight are paramount, choose ease-of-use leaders (Sigma, Tableau, Domo).
- Integration and Scalability Needs: Your ERP/GL is key. If you use Microsoft Dynamics, Power BI is native. For Oracle or SAP, their respective analytics clouds are optimal. For cloud data warehouses (Snowflake, BigQuery), Looker and Sigma excel. Ensure the tool can scale with data volume and user count.
- Security and Compliance Requirements: All financial data needs top security. Row-level security (RLS) is non-negotiable to restrict user access (e.g., by division, region). Public companies or financial services need robust audit trails and compliance certifications (SOC, ISO).
Frequently Asked Questions (FAQs)
Q1: How is Financial BI different from general Business Intelligence?
Financial BI tools are optimized for financial data structures (GL, multi-dimensional charts of accounts), complex calculations (EBITDA, variance analysis), regulatory reporting standards, and planning/forecasting workflows. They prioritize accuracy, auditability, and integration with financial systems over general-purpose data exploration.
Q2: We have Excel. Why do we need a dedicated BI tool?
Excel is great for individual analysis but becomes a risk point for version control, manual errors, and stale data at scale. BI tools provide a single source of truth, automate data refreshes, enable collaboration, offer superior visualization, and handle much larger datasets without crashing.
Q3: What is the typical implementation timeline and cost?
For a focused finance deployment: 2 to 6 months and $20,000 to $100,000+ in software and services. Cost varies wildly by tool, number of users, and complexity of data integration. Cloud SaaS tools have lower upfront costs but ongoing subscriptions.
Q4: How do we ensure data accuracy and a “single source of truth”?
This is achieved by connecting the BI tool directly to your official systems (ERP, Data Warehouse), not manual extracts. Establish a centralized data model or semantic layer (like in Looker or Power BI) where key metrics (e.g., “Revenue”) are defined once and reused by everyone.
Q5: Can non-technical finance staff use these tools effectively?
Yes, absolutely. Modern tools like Tableau, Power BI, and Sigma are designed for self-service. The key is proper training and having a well-prepared, trustworthy data model for them to explore. Start with specific use cases, not open-ended exploration.
Q6: What’s the role of AI/ML in Financial BI?
AI augments finance teams by automating anomaly detection in journals, generating forecast baselines, explaining variances (“What drove the 15% cost increase?”), and enabling natural language queries (“Show me Q3 sales by region”).
Q7: How do we handle sensitive financial data security in a BI tool?
Use Row-Level Security (RLS) to dynamically filter data so users only see what they’re authorized to see (e.g., a regional manager sees only their region’s P&L). Combine this with SSO, detailed audit logs, and encryption. This is a core requirement, not a nice-to-have.
Q8: What’s a common mistake companies make during implementation?
The biggest mistake is “lifting and shifting” old, inefficient Excel reports into a shiny new BI tool without re-engineering the underlying process. Use the implementation as a chance to simplify, standardize, and automate your reporting, focusing on actionable insights.
Q9: Can these tools replace our dedicated FP&A or CPM software?
Increasingly, yes—especially tools like SAP SAC, Power BI with Premium, or dedicated planning modules. They combine BI’s analytical power with planning’s workflow, data entry, and consolidation. Evaluate if a unified BI/planning platform meets your needs before buying separate tools.
Q10: What are the main alternatives to a full BI platform?
Alternatives include: Advanced Excel/Power Pivot (for small teams), reporting modules within your ERP (limited flexibility), custom-built dashboards (high maintenance), or data visualization-only tools that lack financial modeling depth. These often create long-term scalability and maintenance issues.
Conclusion
Choosing the right Business Intelligence tool for your finance team is a strategic decision that directly impacts organizational agility, accuracy, and insight. The market offers a spectrum of solutions, from visualization-focused explorers to deeply integrated enterprise platforms. The “best” choice is not about the most features, but the best fit for your existing tech stack, the skills of your team, and the specific financial questions you need to answer.
Remember, the ultimate goal is to move from reporting the past to illuminating the future. Success depends less on the tool itself and more on a clear strategy: start with well-defined use cases, ensure unwavering data governance, and invest in training your people. A well-chosen financial BI tool is more than software; it’s an engine for strategic advantage, empowering your finance team to guide the business with confidence and clarity.

- Top 10 Email Deliverability Tools: Features, Pros, Cons & Comparison - September 6, 2026
- Top 10 Pharmacovigilance Software: Features, Pros, Cons & Comparison - September 6, 2026
- Top 10 Manufacturing Execution Systems (MES) - July 30, 2026