Introduction
In the digital-first era, your application’s performance is the cornerstone of user satisfaction. Real User Monitoring (RUM) Tools are passive monitoring technologies that record and analyze every interaction a live user has with a website or application. Unlike synthetic monitoring, which uses scripts to simulate behavior in a controlled environment, RUM captures data from actual browser sessions across diverse geographies, devices, and network conditions. It provides an unvarnished view of how “real” people experience your software, measuring vital metrics like page load times, Core Web Vitals, and JavaScript errors in real-time.
The importance of RUM lies in its ability to connect technical performance to business outcomes. If a specific region experiences high latency, RUM tells you exactly which users are affected and how it impacts their conversion rates. Key real-world use cases include identifying front-end bottlenecks that occur only on specific mobile browsers, troubleshooting intermittent checkout errors, and validating the performance impact of a new feature rollout. When choosing a tool, users should evaluate Core Web Vitals support, session replay capabilities, impact analysis (linking speed to revenue), and the script’s weight on page performance.
Best for: Frontend developers, Product Managers, UX designers, and E-commerce leads in organizations ranging from mid-market startups to global enterprises. It is essential for businesses where web performance directly correlates with revenue, such as online retail, SaaS platforms, and digital media.
Not ideal for: Backend-only services, internal CLI tools, or simple static sites with negligible traffic. If you are more concerned with server health than user interface speed, Infrastructure Monitoring or Application Performance Monitoring (APM) is a better starting point.
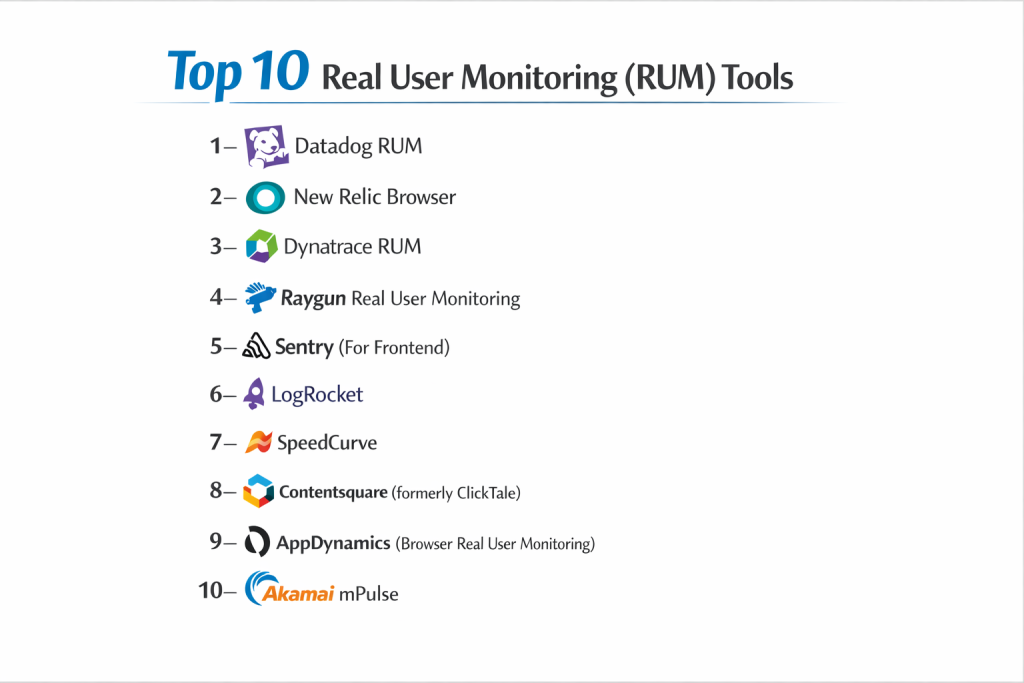
Top 10 Real User Monitoring (RUM) Tools
1 — Datadog RUM
Datadog RUM is part of a unified observability platform that provides end-to-end visibility into the front-end journeys of web and mobile users.
- Key Features:
- Core Web Vitals: Deep tracking of LCP, FID, and CLS for SEO and UX optimization.
- Session Replay: High-fidelity video-like playback of user interactions to visualize bugs.
- Error Tracking: Automatically groups frontend exceptions and correlates them with backend traces.
- Frustration Signals: Detects “rage clicks,” “dead clicks,” and “thrashed scrolls.”
- Custom Attributes: Allows tagging users by plan type, region, or any custom metadata.
- Actionable Heatmaps: Visualizes where users click and how far they scroll.
- Pros:
- Seamlessly correlates frontend issues with backend distributed traces.
- Highly customizable dashboards that satisfy both developers and product owners.
- Cons:
- The cost of session replay can become prohibitive for high-traffic sites.
- The platform is so feature-rich that it can be overwhelming for small teams.
- Security & Compliance: SOC 2 Type II, HIPAA, GDPR, ISO 27001, and FedRAMP authorized.
- Support & Community: 24/7 technical support, extensive documentation, and a massive community of DevOps professionals.
2 — New Relic Browser
New Relic Browser provides deep visibility into how your frontend code performs in the wild, focusing on speed and reliability.
- Key Features:
- SPA Monitoring: Specialized tracking for single-page applications (React, Angular, Vue).
- JavaScript Error Analytics: Detailed stack traces and source map support for debugging.
- AJAX Request Tracking: Monitors the performance of background data fetches.
- Comparative Benchmarking: Compare performance across different browsers and versions.
- Session Traces: A timeline view of every event in a single user session.
- Integrated Vulnerability Management: Identifies security risks in frontend libraries.
- Pros:
- The usage-based pricing model is often more flexible than per-host or per-session models.
- Excellent support for modern JavaScript frameworks.
- Cons:
- The UI can feel cluttered due to the density of data provided.
- Some advanced features require the installation of the full New Relic APM agent.
- Security & Compliance: SOC 2, HIPAA, GDPR, ISO 27001, and PCI DSS compliant.
- Support & Community: “New Relic University” for training; global developer community; robust enterprise support tiers.
3 — Dynatrace RUM
Dynatrace uses its powerful AI engine, Davis, to provide automated answers about how user experience impacts business KPIs.
- Key Features:
- Davis AI: Automatically identifies the root cause of poor user experiences.
- Business Micro-journeys: Tracks specific business goals like “Add to Cart” or “Sign Up.”
- Mobile App Monitoring: Native support for iOS and Android with crash analytics.
- Visual Resolution: Reconstructs the user’s screen to see exactly what they saw during an error.
- Automatic Dependency Mapping: Shows how third-party services (like CDNs) affect RUM.
- User Experience Score: A single, easy-to-understand metric for overall site health.
- Pros:
- The most automated tool on the market; it finds problems without manual configuration.
- Exceptional for large enterprises managing complex, multi-cloud frontends.
- Cons:
- Significantly higher entry price compared to competitors.
- Can feel like a “black box” for developers who want to tinker with raw data.
- Security & Compliance: FedRAMP, SOC 2 Type II, HIPAA, GDPR, and ISO 27001.
- Support & Community: High-touch enterprise support; dedicated account managers; comprehensive help portal.
4 — Raygun Real User Monitoring
Raygun is a developer-centric tool that focuses on providing the exact context needed to fix frontend performance issues.
- Key Features:
- Individual Session Reports: Detailed breakdown of every page visit for every user.
- Instance-level Tracking: See exactly which user experienced a slow load.
- Deployment Tracking: Immediately see if a new release hurt the user experience.
- Core Web Vitals Dashboard: High-level overview of Google’s essential speed metrics.
- Geography & Device Breakdown: Detailed filtering to find localized performance drops.
- First-party Script Impact: Measures how much time your own scripts take to execute.
- Pros:
- Extremely fast and lightweight RUM script with minimal impact on page load.
- Very intuitive UI that focuses on actionable “fix-it” data.
- Cons:
- Lacks the broader infrastructure monitoring capabilities of Datadog or New Relic.
- Session replay features are not as advanced as specialized tools.
- Security & Compliance: SOC 2 Type II and GDPR compliant; data encryption at rest and in transit.
- Support & Community: Highly responsive technical support; active blog; thorough documentation.
5 — Sentry (For Frontend)
While primarily known for error tracking, Sentry has expanded into a powerful performance monitoring tool for frontend applications.
- Key Features:
- Transaction Summary: High-level view of application health and latency.
- Breadcrumbs: A log of events (clicks, console logs) leading up to an error.
- User Feedback API: Prompts users for feedback when an error occurs.
- Release Health: Tracks the adoption and stability of new versions.
- Distributed Tracing: Connects a slow frontend click to the exact backend slow query.
- Profiling: Provides line-of-code visibility into slow JavaScript functions.
- Pros:
- The absolute gold standard for error context and developer experience.
- Very affordable for small to mid-sized teams.
- Cons:
- More focused on “errors” and “latency” than broad “marketing/UX analytics.”
- Dashboarding is not as flexible as general observability suites.
- Security & Compliance: SOC 2 Type II, HIPAA (on certain plans), and GDPR compliant.
- Support & Community: Massive GitHub community; excellent developer documentation; active Discord.
6 — LogRocket
LogRocket combines RUM with deep session replay and product analytics, specifically designed for frontend engineering and product teams.
- Key Features:
- Network Logging: Captures all network requests and responses (including bodies).
- Redux/Vuex State Logging: See the application state at the time of a bug.
- User Experience Analytics: Automatically flags UX issues like “broken buttons.”
- Conversion Funnels: View session replays of users who dropped out of a funnel.
- Conditional Recording: Only record sessions that meet certain criteria (e.g., spent >$100).
- Error Aggregation: Links JavaScript errors to the exact visual moment they happened.
- Pros:
- Unrivaled for “reproducing” complex frontend state bugs.
- Bridges the gap between technical monitoring and product analytics perfectly.
- Cons:
- The high level of data capture (network bodies, state) requires careful PII masking.
- Can be resource-heavy for user browsers if not configured correctly.
- Security & Compliance: SOC 2 Type II, HIPAA (with BAA), and GDPR compliant.
- Support & Community: Direct engineering support; active blog; clear onboarding guides.
7 — SpeedCurve
SpeedCurve is a specialized performance monitoring tool that excels at visualizing the “human” side of web performance and competitive benchmarking.
- Key Features:
- LUX (Live User Experience): Their proprietary RUM solution for real-time data.
- Competitive Benchmarking: Track your site against competitors on the same dashboard.
- Performance Budgets: Alerts you when your site exceeds size or speed limits.
- Visual Metrics: Tracks “Speed Index” and “Hero Element Timing.”
- Design-Focused: Shows how performance correlates with design changes.
- Synthetic + RUM: Seamlessly switch between lab data and field data.
- Pros:
- The best visualizations in the industry for communicating performance to stakeholders.
- Deep focus on “perceived performance” (how fast it feels to a user).
- Cons:
- Specialized for web; not a good fit for native mobile app monitoring.
- Lacks deep backend/infrastructure correlation features.
- Security & Compliance: GDPR compliant; SSO available for enterprise plans.
- Support & Community: Founded by performance experts; highly technical support; great webinars.
8 — Contentsquare (formerly ClickTale)
Contentsquare is a digital experience analytics platform that leans more toward the “Product and UX” side of RUM.
- Key Features:
- Zone-based Heatmaps: Shows how much revenue each element on a page generates.
- Customer Journey Analysis: Visualizes the most common paths users take.
- Struggle Analysis: Uses AI to find where users are getting frustrated.
- Error Analysis: Quantifies the financial impact of technical errors.
- Accessibility Monitoring: Automatically finds accessibility issues for WCAG compliance.
- Pros:
- The best tool for connecting technical performance to “dollars and cents.”
- Powerful for UX researchers and conversion rate optimization (CRO) teams.
- Cons:
- Very expensive; targeted almost exclusively at the enterprise market.
- Less “developer-centric” than tools like Sentry or Datadog.
- Security & Compliance: ISO 27001, SOC 2 Type II, HIPAA, and GDPR compliant.
- Support & Community: Global professional services; dedicated success managers; extensive academy.
9 — AppDynamics (Browser Real User Monitoring)
AppDynamics, a Cisco company, provides an enterprise-ready RUM solution that is part of their broader “Business Observability” suite.
- Key Features:
- Business IQ: Correlates app performance with business metrics in real-time.
- Browser Snapshots: Captures detailed diagnostic data for outlier sessions.
- Resource Timing: Breaks down time spent on DNS, TCP, and SSL.
- IoT Monitoring: Extends monitoring to smart devices and kiosks.
- Baseline-based Alerting: Only alerts when performance deviates from “normal.”
- Pros:
- Strongest choice for companies already in the Cisco/AppDynamics ecosystem.
- Excellent for highly complex, hybrid-cloud enterprise environments.
- Cons:
- The setup and configuration are more labor-intensive than modern SaaS tools.
- The interface can feel more “IT-ops” than “modern-developer.”
- Security & Compliance: SOC 2 Type II, HIPAA, GDPR, and ISO 27001 compliant.
- Support & Community: Robust enterprise support; large global partner network.
10 — Akamai mPulse
mPulse is a high-performance RUM solution designed for some of the largest websites on the planet, with a focus on big data and CDN integration.
- Key Features:
- Predictive Analytics: Shows how much faster your site needs to be to hit a conversion goal.
- What-if Analysis: Simulate the business impact of a 100ms speed improvement.
- Edge Integration: Leverages Akamai’s CDN to collect and process RUM data.
- Timer/Metric Customization: Track virtually any user event or technical metric.
- Massive Scale: Capable of processing billions of beacons per day.
- Pros:
- The analytics engine for business impact is second to none.
- Ideal for high-traffic media and retail sites already using Akamai.
- Cons:
- Can be overly complex for smaller organizations.
- Integration works best within the broader Akamai product suite.
- Security & Compliance: PCI DSS, SOC 2, HIPAA, and GDPR compliant.
- Support & Community: High-tier enterprise support; technical account managers; extensive documentation.
Comparison Table
| Tool Name | Best For | Platform(s) Supported | Standout Feature | Rating (Gartner) |
| Datadog RUM | Full-Stack DevOps | Web, iOS, Android | Integrated Session Replay | 4.6 / 5 |
| New Relic | Value & SPA | Web, Mobile | Pixie eBPF Integration | 4.5 / 5 |
| Dynatrace | Enterprise AI | All Platforms | Davis AI Root Cause | 4.6 / 5 |
| Raygun | Developer Context | Web, Mobile | Instance-level Detail | 4.5 / 5 |
| Sentry | Error Context | Web, Mobile | Developer Workflow | 4.5 / 5 |
| LogRocket | Reproducing Bugs | Web, Mobile | Redux State Logging | 4.7 / 5 |
| SpeedCurve | Perceived Perf. | Web | Competitive Benchmarking | 4.8 / 5 |
| Contentsquare | Business/UX | Web, Mobile | Revenue-based Heatmaps | 4.4 / 5 |
| AppDynamics | Hybrid Enterprise | All Platforms | Business IQ Correlation | 4.3 / 5 |
| Akamai mPulse | High-Traffic Retail | Web, Mobile | Predictive conversion ML | 4.4 / 5 |
Evaluation & Scoring of RUM Tools
To help you choose, we have evaluated these tools against a weighted rubric based on industry requirements.
| Criteria | Weight | Evaluation Logic |
| Core Features | 25% | Core Web Vitals, Error Tracking, and Geolocation data. |
| Ease of Use | 15% | Time to instrument and clarity of the reporting UI. |
| Integrations | 15% | How well it talks to your backend APM and Cloud tools. |
| Security & Compliance | 10% | PII masking, SOC 2, and data residency options. |
| Performance | 10% | The “weight” of the RUM script on the user’s browser. |
| Support & Community | 10% | Documentation quality and responsiveness of support. |
| Price / Value | 15% | Transparency and ROI on business impact analysis. |
Which RUM Tool Is Right for You?
Solo Users vs SMB vs Mid-Market vs Enterprise
- Solo Users/Startups: Start with Sentry or Raygun. They are affordable, developer-friendly, and provide the most “bang for your buck” in the early stages.
- Mid-Market: Datadog or LogRocket are the sweet spots. They offer the scalability you need as your traffic grows, along with deeper session replay features.
- Enterprise: Dynatrace, Contentsquare, or Akamai mPulse are the standard. Large organizations need the high-level business impact modeling and AI automation these platforms provide.
Budget-Conscious vs Premium Solutions
If you are on a tight budget, New Relic’s free tier is remarkably generous. If you are a premium brand where every 100ms equals $1M in sales, SpeedCurve or Contentsquare provide the specialized depth that justifies their price.
Feature Depth vs Ease of Use
- Highest Ease of Use: Raygun and SpeedCurve.
- Highest Feature Depth: Dynatrace and Datadog.
Integration and Scalability Needs
If your stack is 100% on the cloud and you value unified data, Datadog is the winner. If you are an older enterprise with on-premise components and a massive Cisco presence, AppDynamics is the logical choice.
Frequently Asked Questions (FAQs)
Q1: What is the difference between RUM and Synthetic Monitoring?
Answer: Synthetic monitoring uses scripts to simulate user behavior in a clean environment (perfect for uptime checks). RUM captures the experience of actual users in the real world (perfect for understanding UX and performance across different devices).
Q2: Will a RUM script slow down my website?
Answer: Most modern RUM scripts (like Raygun or SpeedCurve LUX) are asynchronous and very small (under 30KB). They are designed to load after the main content, meaning they have a negligible impact on speed.
Q3: Is RUM data compliant with GDPR?
Answer: Yes, provided you choose a tool with strong PII (Personally Identifiable Information) masking. Most top-tier tools automatically mask IP addresses and sensitive input fields.
Q4: Can RUM track mobile apps?
Answer: Many but not all. Tools like Datadog, Dynatrace, and New Relic have native SDKs for iOS and Android. Specialized web tools like SpeedCurve do not.
Q5: What are Core Web Vitals?
Answer: They are a set of metrics (LCP, FID, CLS) that Google uses to measure page speed and visual stability. Most RUM tools now center their dashboards around these metrics because they impact SEO.
Q6: What is “Session Replay”?
Answer: It is a feature that allows you to watch a reconstruction of a user’s session. It is incredibly helpful for seeing exactly what a user did before they encountered a bug.
Q7: Why is “High Cardinality” important in RUM?
Answer: High cardinality allows you to filter data by very specific values, like a single User ID or a specific browser version (e.g., Chrome 114.0.5). This is essential for debugging niche issues.
Q8: Can RUM help me increase revenue?
Answer: Yes. Tools like Akamai mPulse and Contentsquare show the direct correlation between page speed and conversion rates, helping you prioritize performance fixes that have the highest ROI.
Q9: Do I need RUM if I already have Google Analytics?
Answer: Yes. Google Analytics is a marketing tool that tracks “who” came to the site. RUM is a technical tool that tracks “how” the site performed for them. GA is not detailed enough for technical debugging.
Q10: Is it hard to install these tools?
Answer: Usually, it’s just a single line of JavaScript code added to your site’s header. Advanced features like session replay or custom event tracking may require a bit more configuration.
Conclusion
Choosing the right Real User Monitoring (RUM) tool is about finding the balance between technical depth and business clarity. If you are a developer tasked with crushing frontend bugs, Sentry or LogRocket will be your best friends. If you are a product leader trying to justify a performance budget to the board, SpeedCurve or Contentsquare provide the visual evidence you need.
The most important takeaway is that performance is no longer just an “IT problem”—it is a fundamental part of the customer experience. By implementing a RUM tool, you stop guessing how your users feel and start knowing exactly what they experience.

- Top 10 Email Deliverability Tools: Features, Pros, Cons & Comparison - September 6, 2026
- Top 10 Pharmacovigilance Software: Features, Pros, Cons & Comparison - September 6, 2026
- Top 10 Manufacturing Execution Systems (MES) - July 30, 2026