Top 5 Code Coverage Tools | Best Test Coverage Tools

Today we will talk about code coverage tools which are used by developers for measuring the quality of the software testing. There are so many different types of code coverage tools, some are basics and others that are exceptionally thorough.
But before going further on tools let’s first see what is Code Coverage?
Code Coverage is a methodology, which is performed to measure and describe how much the source code of a program is executed when a specific test suite runs. It gives a percentage score to a program which defines as a high code coverage and low code coverage. If it gets high percentage of code coverage during testings which means it has a minimal chance of containing undiscovered software bugs in the comparison of a program which scored low percentage of code coverage while testing. In simple words , code coverage is performed to check whether your tests are really analyzing your code or not. With code coverage, one can tell the amount of your code is being tested by running the test.
Where to use ?
Code coverage tools can be performed on .NET, Java, Visual C/C++ and Visual Basic applications.
Benefits of Code Coverage
Dead Code Identification – The first and the major benefits of code coverage is that after running this test you will get the outputs that shows those functions which are not called, after detecting that you can identify whether the code is untouched as no required use case exists or code is dead code (i.e. not required).
Missing test Identification – It can be beneficial in identifying the extra tests (exceptional cases), which are missed out earlier after running the test suites analysis report.
Quality Assurance – Quality of a product or application is one of the major concern in software world and this can be done by measuring the report after running the code coverage. Higher the amount of coverage better will be the quality of product or application and lesser is the chance to have defects.
Now the next question here is which code coverage tools to choose ?
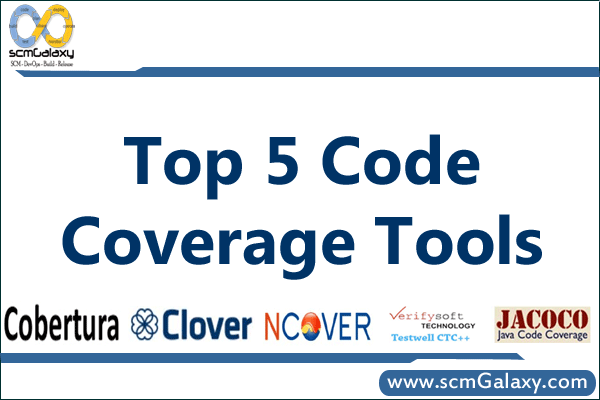
This is the real challenge to choose which code coverage tools to use for application testing. I also thought about it and after few hours research on the internet and with the help of google trend I shortlisted my results and pick top 5 code coverage tools.
1. Cobertura –
code-coverage-tool-cobertura
Cobertura is one of the most used and best code coverage tools. This is a free Java tool that calculates the percentage of code accessed by tests. It can be used to identify which parts of your Java program are lacking test coverage. It is based on jcoverage. It is easy to use and can measure coverage without having the source code. It’s represents reports in HTML or XML format, It has capacity to test lines and branches of class and method.
2. JaCoCo –
code-coverage-tool-jacoco
JaCoCo is also an open source free code coverage tools for Java, which has been made by the EclEmma group in view of the lessons gained from utilizing and joining existing libraries for a long time. JaCoCo offers instructions, line and branch coverage. It can instrument off-line and on-the-fly and It fully supports Java 7 and Java 8. It also has capacity to test lines and branches of class and method. It also provide very nice and easy to navigate HTML or XML report.
3. Clover –
code-coverage-tool-clover
Clover is also a Java Code Coverage tools bought and further developed by Atlassian. It is also an open source tool. Clover provide very helpful configurable HTML reports demonstrating code scope as well as high level risks and so on, per-test code coverage and test enhancement, dispersed per-test coverage and many instrument integration; it is by and large effectively created and supported.
4. NCover-
code-coverage-tool-ncover
NCover is a code coverage tool for .Net programs and applications. It supports statement coverage and branch coverage. It is also very easy to use and fast tool which is available on open source and as well as on commercial license. This tool can perform manual as well as automated code coverage tests and it provides nice and attractive multiple testing environments.
5. Testwell CTC++ –
code-coverage-tool-testwell-ctc++
Testwell CTC++ is a code coverage tool for  C and C++ but it also can be used for Java and C#. The development of this tool is belongs to Testwell which lately acquired by Verifysoft Technology GmbH for C and C++. This tool can check Statement Coverage, Function Coverage, Decision Coverage, Multi Condition Coverage, Modified Condition/Decision Coverage (MC/DC), Condition Coverage. This is also in the category of user-friendly and fast tools. It finds missing test cases smoothly. It provide reports on XML format.
So, This is my list of top code coverage tools, I hope this list will help you in your testings. But, if you think this list should contain any other tools instead these than feel free to share with us in comment box below.
Tagged : / / / / / / / / / / / / / / /

Difference between Code Coverage and Test Coverage | Code Coverage VS Test Coverage

code-coverage-and-test-coverage-difference

There is not any official distinguished between code Coverage and Test Coverage. Some practitioner has expressed their difference opinion in terms of defining Code Coverage and Test Coverage.
Code coverage and test coverage metrics are both measurements that can be seful to assess the quality of your application code. Code coverage is a term to describe which application code is exercised when the application is running.

Whereas Test coverage refers to metrics in an overall test-plan. In this expert  response, you’ll learn how quality assurance professionals use both of these metrics effectively.

Another definition found over the google search as below;
Code coverage is a measure of how much code is executed during testing &
Test coverage is a measure of how many test cases have been executed during testing.

Lets know about  Code Coverage by definition more in details.
In computer science, code coverage is a measure used to describe the degree to which the source code of a program is tested by a particular test suite. A program with high code coverage has been more thoroughly tested and has a lower chance of containing software bugs than a program with low code coverage. Many different metrics can be used to calculate code coverage; some of the most basic are the percent of program subroutines and the percent of program statements called during execution of the test suite.

Basic coverage criteria

There are a number of coverage criteria, the main ones being:

  • Function coverage – Has each function (or subroutine) in the program been called?
  • Statement coverage – Has each statement in the program been executed?
  • Branch coverage – Has each branch (also called DD-path) of each control structure (such as in if and case statements) been executed? For example, given an if statement, have both the true and false branches been
  • executed? Another way of saying this is, has every edge in the program been executed?
  • Condition coverage (or predicate coverage) – Has each Boolean sub-expression evaluated both to true and false?

[Taken from Wikipedia]

Simply put, code coverage is a way of ensuring that your tests are actually testing your code. When you run your tests you are presumably checking that you are getting the expected results. Code coverage will tell you how much of your code you exercised by running the test. Your tests may all pass with flying colours, but if you’ve only tested 50% of your code, how much confidence can you have in it?

Tagged : / / / / / / / / / / /

What is Code Coverage and Why Code Coverage?

code-coverage

What is Code Coverage
Code Coverage is an important measurement in Software Quality Engineering. While Software testing ensures correctness of the applications, a metric is required to track the What is Code Coverage Code Coverage is an important measurement in Software Quality Engineering. While Software testing ensures correctness of the applications, a metric is required to track the completeness and effectiveness of the testing undertaken. Code Coverage helps achieve reliable quality through identifying untested areas of the application.

Why Code Coverage
Software testing is a challenging function. The testers need to ensure complete functional and non-functional correctness of the product. Considering the complex workflows and use cases of modern day applications, the number of unique cases that the software can be used often run into millions, which is not feasible to be covered under testing exercise. The testers thus need to
– While Planning Tests
o Ensure covering all workflows in terms of decision trees in the code
o Ensure covering all data values – by identifying patterns rather covering millions of values
– While testing
o Ensuring the testing is completely exercising the whole application with planned and exploratory tests.

At the end of testing, the decision to stop testing and release the product still remains subjective, based on the presence or absence of bugs, inflow of new bugs, success rate of each test cycle, confidence rating of the testers or users, etc. Whereas the definitive metric of quantifying how much of the application was really tested, is missed.

Code Coverage is measured as quantification of application code exercised by the testing activities. Code Coverage can be measured at various levels – in terms of programming language constructs – Packages, Classes, Methods, Branches or in terms of physical artifacts – Folders, Files and Lines. For Eg. A Line Coverage metric of 67% means the testing exercised 67% of all executable statements of the application. A Code Coverage metric usually is accompanied by Code Coverage Analysis Report – which helps identify the un-tested part of the application code, thereby giving the testers early inputs for complete testing.

Benefits of Code Coverage

  • Objective Indicator of Test Coverage of application code
  • Pointers to uncovered Packages / Classes / Methods / Branches
  • Pointers to uncovered Folders / Files / Lines
  • Drill down to untested part of source code and devise new tests
  • Early Indicator for Testing Quality and Fixing it by adding new tests.
  • Remove redundancy in testing
  • Increased Confidence for Releases

Test Your Test

Typical Emotional Storyboard

  • Write Some code! Happy!
  • Does it work? Sad!
  • Write some test! Happy!
  • Do they really test the code? Sad!
  • Measure the Code Coverage! Happy!

Coverage Measurement

  1. Shows Which line of code are executed
  2. How much of your code is covered by your tests?
  3. Your tests test your product
  4. Coverage testing tests your tests

Goal

  • 100%
  • Coverage Ideal
  • Not Always possible
  • Can be expensive to achieve
  • Design for testability

Good: Write more tests
Only way to truly increase code coverage

Bad
Excluding Code to boost Coverage

Types of Coverage

  1. Statement Coverage
  2. Branch Coverage
  3. Path Coverage
  4. Loop Path Coverage
  5. Data – driven Code
  6. Complex Conditionals
  7. Hidden Branches

How; – Coverage Tools

  1. Clover
  2. Cobertura
  3. Emma
Tagged : / / / / / / / / / / / / /

Overview of EMMA | Code Coverage Tool – EMMA

emma-overviewOverview

EMMA is a tool for measuring coverage of Java software. Such a tool is essential for detecting dead code and verifying which parts of your application are actually exercised by your test suite and interactive use.
EMMA’s design strives for several, very elusive in their combination, goals:

  • report rich coverage analysis data without introducing significant overhead during either build or execution time
  • be useful in team development environments, while at the same time enabling fast individual develop-test cycle
  • support quick development and testing of small standalone Java applications as well as scale up to massive enterprise sotfware suites containing thousands of Java classes

Advantages of Emma over other coverage tools

EMMA differs from other coverage tools in its extreme orientation towards fast iterative develop-test style of writing software. JVM Profiler Interface (JVMPI)-based tools do not require an instrumented source build, but the runtime overhead of running with JVMPI on is empirically known to be very high and results in depressingly slow testsuite runs. For tools based on source code instrumentation, having to wait for a full source code rebuild just to check coverage metrics is not something a normal developer wants to do several times during a day. EMMA’s goal is to be so unintrusive that frequent daily checking of coverage numbers becomes second nature to every developer on the team, if not a completely automatic byproduct of every test run.

Install and Configuration

Method 1: To run on Command Line.
Copying emma.jar to <your jre dir>/lib/ext/ directory for whichever JRE you use from command line.
Method 2:
Still, if you are wary of adding a third-party library as a standard JRE extension, just make sure that all your EMMA command line invocations add emma.jar to the JVM classpath:
>java -cp …/lib/emma.jar <emma or emmarun command>

Implementing EMMA with Application

  • On the Fly Mode – Based suited for Standalone Application
  • Offline Mode – Best suited for J2EE framework based application

Implement EMMA in J2EE project {WebLogic, Websphere, Tomcat, JBoss, …}?

There are very less opportunities given by Emma that  you would be able setup emma for J2EE Project on the fly mode. The reason behind this to fact that many J2EE features requires specialized class loading that will happen outside EMMA instrumenting class holder. The server might run fine but you will unlikely to get EMMA report.
So, based Procedures to Instrument your classes prior to deployment (offline mode); offline instrumentation always follows the same compile / instrument / Package / deploy / get coverage / Generate report sequence.
There are following steps need to follow to implement EMMA in J2EE based project…

  • Use EMMA’s instr tool to instrument the desire classes. This can be done a post compilation step, before packaging. However many users also find it convenient to let EMMA process their jars directly (either in place, using overwrite mode, or by creating separate instrumented copies of everything, fullcopy mode.
  • do your J2EE packaging as normal, but do not include emma.jar as a lib at this level, that is, within your .war, .ear, etc;
  • locate whichever JRE is used by the container and copy emma.jar into its <jre dir>/lib/ext directory. If that is impossible, add emma.jar to the server classpath (in a server-specific way);
  • deploy your instrumented classes, .jars, .wars, .ears, etc and exercise/test your J2EE application via your client-side testcases or interactively or whichever way you do it;
  • to get a coverage dump file, you have three options described. It is highly recommended that you use coverage.get  control command with the ctl tool available in v2.1.

Notes:

Reference:
http://emma.sourceforge.net/faq.html#q.runtime.appservers
http://emma.sourceforge.net/reference/ch02s03.html#tool-ref.instr.outmodes

Emma Integration with other tools

Emma Integration with Sonar
Emma Integration with Hudson
Emma Integration with CruiseControl

jar instrumentation using Emma

http://primates.ximian.com/~flucifredi/emma-HOWTO.html
http://emma.sourceforge.net/reference/ch02s03.html#tool-ref.instr.outmodes
http://primates.ximian.com/~flucifredi/emma-HOWTO.html
http://groovy.329449.n5.nabble.com/EMMA-Code-Coverage-has-problem-with-Groovy-classes-td360560.html

Tagged : / / / / / / / / / /