Top 10 Bug/Issue Tracking Tools | List of Best Bug/Issue Tracking Tools

top-10-bug-issue-tracking-tool
Just imagine a situation when you put so much efforts to build a software or application and release it and after that users get error or issues in it on the very first use. That’ it, all your efforts will be useless. So, testing is an important aspect which you can not miss in your “Software Development Life-cycle” (SDLC). But, for that you need some tools or I would say good tools, so that you can make sure you are going to give an error or bug free experience to your application or software end users.
But, there is one big challenge that you will face, How to choose or select best bug tracking tools? Don’t worry, I am going to make this task easy for you. I have done some research and make a list of top ten bug tracking tools which I am going share.
So, without any further delay, let’s check out

1. Bugzilla


 Bugzilla

Bugzilla is one of the most popular and trustable bug tracking software serving since 18 long years. It’s belongs to Mozilla Foundation and was released in the year 1998 and written in Perl. Bugzilla is open sourced and free to use.
Key Features
  • Basic and advance search features with save & share options
  • Notifications by Email
  • Scheduled Reports by Email
  • Advanced reporting system
  • Auto Detection of Similar Bugs
  • Patch Viewer which makes code review much easier
  • Excellent Security
  • Localization
  • Move Bugs Between Installations without any manual work
  • Request System where you can ask other users to do something with a particular bug or attachment
  • Optimized database structure for increased performance and scalability

2. Mantis Bug Tracker

Mantis Bug Tracker


Mantis or Mantis BT is also an open source bug tracking tool. It’s is written in PHP and serving since 2000 almost for 17 years. It was first developed by “Kenzaburo Ito” and later by few others as a team project.
Key Features
  • Easy to Install & Use
  • No limit on the number of users, issues, or projects
  • Email notifications
  • Functionality can be extended by plugins
  • Flexibility to customize issue fields, notifications and workflow
  • Per project different access level for users
  • Source Control Integration
  • Easy collaboration with team members & clients
  • Built-in Reporting
  • Available in 68 localizations
3. Jira
Jira
Jira is a bug/issue tracking and project management tool which was developed by Atlassian, Inc. almost 15 years ago in the year 2002. It is written in Java. It’s available under commercial license but in few scenarios like official non-profit organizations, charities, academic or religious organizations you can use it for free.
Key Features
  • Code Integration – automatically updating issues when they check in code
  • Keep history of issues from either customers or bugs
  • Multiple Workflows
  • Easy to assign and prioritise the bug issue as per the importance and urgency
  • Comprehensive Issue Reports
  • Customizable Dashboard
  • Bugs can be imported from a CSV file
  • Trigger notifications allow auto informing to the next reviewer
  • Addons availability like Capture for JIRA which allows backlog to release
 

4. Redmine

Redmine

Redmine is an open source bug tracking tool which was developed by Jean Philippe Lang in the year 2006 (almost 10 yrs ago) and it is written in Ruby on rails.
Key Features
  • Define you own statuses and issue types
  • Workflow transitions can be set up for each issue type and role
  • Feeds & email notifications
  • Issue creation via email
  • Multi Language support
  • User self-registration support
  • Time tracking functionality
5. Trac
Trac
Trac is also an bug tracking tool written in python and developed by Edgewall Software 13 years ago in the year 2004. It’s available as open source and as a BSD license product.
Key Features
  • Resolve issues through multiple workflows
  • Ticket Tracking
  • Email notification
  • Plugins support for standard functionality
  • Customizable workflow
  • Unicode Supported
  • Code Integration
  • Custom Fields
  • Integrated wiki
  • Collaboration – Create teams and groups
6. The Bug Genie

The Bug Genie

The bug Genie is an open source bug tracking tools which is developed by Daniel Andre Eikeland and later by there team in the year 2003. This bug tracking software is written in PHP and supports cross platforms. It is said that it is one of the most beautiful tool to use and having a great interface.
Key Features
  • Easy to use
  • Finding issues is simple and fast
  • Customise search results
  • Custom issue fields
  • RSS support
  • Issue-related actions are available with a click
  • Integrated quick search
  • Customizable workflow
7. Fossil

Fossil

Fossil was first released 11 years ago in the year 2006. This is written in C, SQL and developed by D. Richard Hipp. It’s available under BSD license. Fossil also supports cross platforms
Key Features
  • User friendly web interface
  • Auto sync mode
  • Custom Fields
  • SUpports Multiple Projects
  • RSS Notification interface
  • Easy collaboration
  • Ticket Change Artifacts
8. eTraxis

eTraxis

eTraxis is written in PHP and supports multi-database and multi languages. It is an open source bug tracking tool. Let’s check out eTraxis key features
Key Features
Complete customization of the workflow
Extensive permissions management
Allow Commenting
Email notifications
Flexible to set up your own filters & views
Supports attachments in reported issue
You can check out complete history of all events, actions, and changes
9. WebIssues

WebIssues

WebIssues is a multi platform open source issue tracking tool. It is written in PHP and works with MySQL database. It is amongst easy to use issue tracking softwares with some good features.
Key Features
  • Tracking new and modified issues
  • Filtering and searching issues
  • Easy installation and setup
  • Reports can be exported as HTML and PDF documents
  • Issues can also be exported in CSV format
  • Email notifications
  • Periodic reports can be sent
  • Security and rights management
  • supports team collaboration
  • Easy to Customize
10. HP ALM/ Quality Center

HP ALM/ Quality Center

HP Quality center is written in .NET & Java which is developed by Hewlett-Packard (formerly Mercury Interactive). It was first released in the year 1995. It is a quality management tool with integrated bug tracking system. It’s available under commercial license but you can use free trial for few days.
Key features
  • Test Planning integration
  • Customizable workflow
  • Custom Fields
  • Plug Ins Availability
  • Supports Multiple Projects
  • Web, GUI & Rest input interface
  • Email Notifications
  • Reporting and graphing
  • Collaboration – supports working in common integrated development environments

So, That’s it. These are most popular bug tracking tools used in software industry these days. Hope my efforts will help while choosing the bug/issue tracking tool. But, now it’s your turn. If you think any other tool should be listed here instead of this than please share with us in the comment section below.
Tagged : / / / / / / / / / / / / / / / / / / / / / / / /

Top 10 Static Code Analysis Tool | Best Static Code Analysis Tools List

top-10-static-code-analysis-tool
Software security is a very important concern for todays Software market and for that you need to do code analysis in the development lifecycle. Now we can not imagine ourselves to sit back and do manual reading each line of codes and find issues and bugs. Those days of manual review in the software development lifecycle to find the flaws in the codes are over now.
Now the mindsets has changed and developing quality & secure code from the beginning is on rise. This is the time of automation and developers & programmers are now shifting towards the adoption of tools which auto detects the flaws as soon as possible in the software development lifecycle.
As the process shifting towards the automation, static code analysis (SCA) has become an important part of creating quality code. Now the question here is, What is Static Code Analysis?

Static Code Analysis is a technique which quickly and automatically scan the code line by line to find security flaws and issues that might be missed in the development process before the software or application is released. It functions by reviewing the code without actually executing the code.

There are three main benefits of Static analysis tools
1. Automation —  Automation can save your time and energy which ultimately means you can invest your time and energy in some other aspects of development lifecycle, which will help you to release your software faster.
2. Security — Security is also one of the major concern and by adopting Static analysis you can cut the doubt of security vulnerabilities in your application, which will ensure that you are delivering a secure and reliable software.
3. Implementation — Static analysis can be implemented as early in the software development lifecycle (SDLC) as you have code to scan, it will give more time to fix the issues discovered by the tool. The best thing of static analysis is that it can detect the exact line of code that’s been found to be problematic.
There are so many Static code analysis tools are available to ease our work but to choose good tools among them is really a challenging task. I have done some research and providing you the list of top 10 static code analysis tools:-

1. VisualCodeGrepper

static-code-analysis-tool-visualcodegrepper
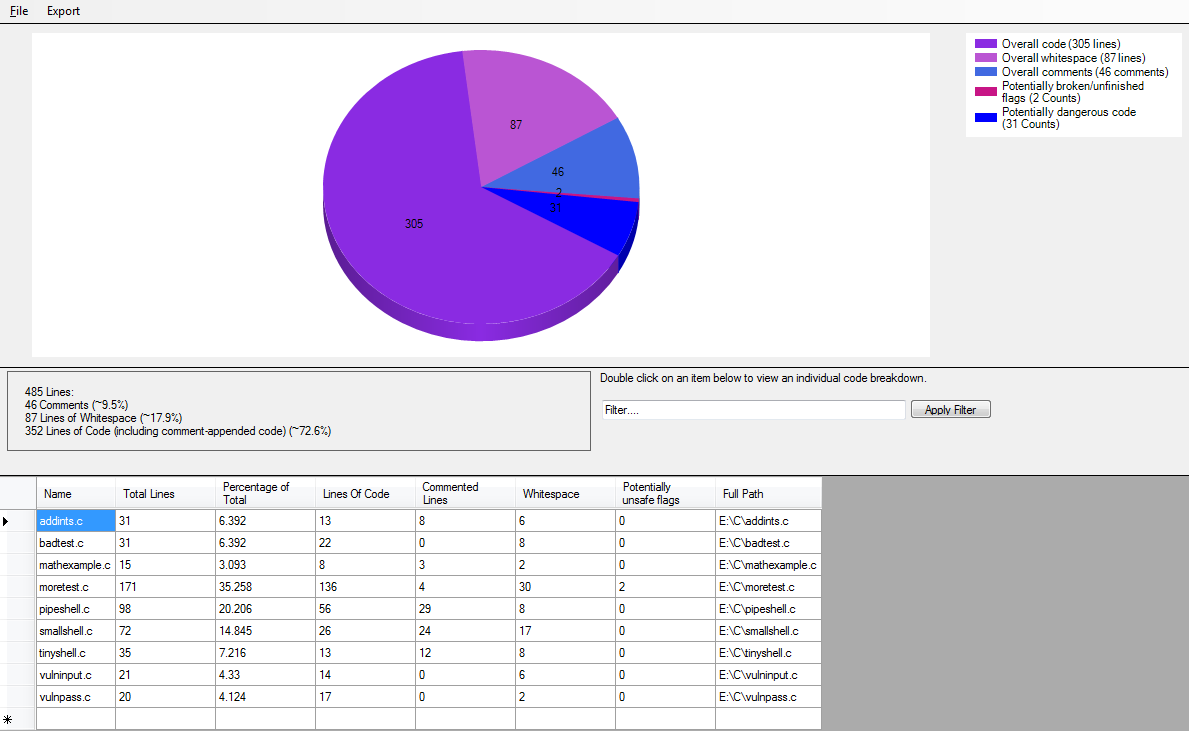
Visualcodegreeper is an open source automated code security review tool which works with C++, C#, VB, PHP, Java and PL/SQL to track the insecurities and different issues in the code. This tool rapidly review and depicts in detail the issues it discovers, offering a simple to use interface. It allows custom configurations of queries and it’s updated regularly since its creation (2012).
2. Coverity

static-code-analysis-tool-coverity

Coverity is also an open source static code analysis tool which supports C, C++, C#, Objective-C, Java, Javascript, node.JS, Ruby, PHP & Python. It is an excellent static analysis product with support of 100 compilers & detailed and clear description of the code issues you can use it in your desktop environment to quickly find and resolve the errors before checking in the code.

3. Veracode

static-code-analysis-tool-veracode

Veracode is also one of the best static code analysis tool which can find security flaws in application binary code – compiled or “byte” code even when the consideration of source code is not available. Veracode supports multi-languages which includes .NET (C#, ASP.NET, VB.NET), Java (Java SE, Java EE, JSP), C/C++, JavaScript (including AngularJS, Node.js, and jQuery), Python, PHP, Ruby on Rails, ColdFusion, Classic ASP, including mobile applications on the iOS and Android platforms and written in JavaScript cross platform frameworks.

4. YASCA

static-code-analysis-tool-yasca

“Yet Another Source Code Analyzer (YASCA)” is an open source stactic code analysis tool which supports HTML, Java, JavaScript, .NET, COBOL, PHP, ColdFusion, ASP, C/C++ and some other languages. It is an easy to extend and a flexible tool which can integrate with variety of other tools which includes CppCheck, Pixy, RATS, PHPLint, JavaScript Lint, JLint, FindBugs and various others.
5. Cppcheck

static-code-analysis-tool-cppcheck

Cppcheck is an open source static code analysis tool for C/C++. Cppcheck basically identifies the sorts of bugs that the compilers regularly don’t recognize. The objective is to identify just genuine mistakes in the code. It provides both interface command line mode and graphical user interface (GUI) mode and has possiblitites for environment integration. Some of them are Eclipse, Hudson, Jenkins, Visual Studio.

6. Clang


static-code-analysis-tool-clang
Clang is also one of the best static code analysis tool for C, C++ and objective-C. This analyzer can be run either as standalone tool or within Xcode. It is an open source tool and a part of the clang project. It utilizes the clank library, hence forming a reusable component and can be utilized by multiple clients.

7. RIPS


static-code-analysis-tool-rips
RIPS is a static code analyzer tool to detect different types for security vulnerabilities in PHP codes. RIPS also provide integrated code audit framework for manual analysis. It is an open source tool too and can be controlled via web interface.
8. Flawfinder
static-code-analysis-tool-flawfinder
Flawfinder is also one of the best static analysis tool for C/C++. This tool is easy to use and wel designed. It reports possible security vulnerabilities sorted by risk level. It is an open source tool written in python and use command line interface.
9. DevBug
static-code-analysis-tool-devbug
DevBug is an online PHP static code analyser which is very easy to use and written on Javascript. It was intended to make essential PHP Static Code Analysis accessible on the web, to raise security mindfulness and to incorporate SCA into the development procedure. This analyser tool is also available in open source.

10. SonarQube


static-code-analysis-tool-devbug
SonarQube is one of the best and well known open source web based static code analysis tool, it can scan projects written in many different programming languages including  ABAP, Android (Java), C, C++, CSS, Objective-C, COBOL, C#, Flex, Forms, Groovy, Java, JavaScript, Natural, PHP, PL/SQL, Swift, Visual Basic 6, Web, XML, Python and also allows a number of plug ins. What makes SonarQube really stand out is that It provides metrics about your code which will to help you to take the right decision and translates these non-descript values to real business values such as risk and technical debt.
So, above we mentioned top selective static code analysis tools which can be helpful, but if you think this lists should contain some other tools than feel free to share in comment box.
Tagged : / / / / / / / / / / / / / /

Difference between Code Coverage and Test Coverage | Code Coverage VS Test Coverage

code-coverage-and-test-coverage-difference

There is not any official distinguished between code Coverage and Test Coverage. Some practitioner has expressed their difference opinion in terms of defining Code Coverage and Test Coverage.
Code coverage and test coverage metrics are both measurements that can be seful to assess the quality of your application code. Code coverage is a term to describe which application code is exercised when the application is running.

Whereas Test coverage refers to metrics in an overall test-plan. In this expert  response, you’ll learn how quality assurance professionals use both of these metrics effectively.

Another definition found over the google search as below;
Code coverage is a measure of how much code is executed during testing &
Test coverage is a measure of how many test cases have been executed during testing.

Lets know about  Code Coverage by definition more in details.
In computer science, code coverage is a measure used to describe the degree to which the source code of a program is tested by a particular test suite. A program with high code coverage has been more thoroughly tested and has a lower chance of containing software bugs than a program with low code coverage. Many different metrics can be used to calculate code coverage; some of the most basic are the percent of program subroutines and the percent of program statements called during execution of the test suite.

Basic coverage criteria

There are a number of coverage criteria, the main ones being:

  • Function coverage – Has each function (or subroutine) in the program been called?
  • Statement coverage – Has each statement in the program been executed?
  • Branch coverage – Has each branch (also called DD-path) of each control structure (such as in if and case statements) been executed? For example, given an if statement, have both the true and false branches been
  • executed? Another way of saying this is, has every edge in the program been executed?
  • Condition coverage (or predicate coverage) – Has each Boolean sub-expression evaluated both to true and false?

[Taken from Wikipedia]

Simply put, code coverage is a way of ensuring that your tests are actually testing your code. When you run your tests you are presumably checking that you are getting the expected results. Code coverage will tell you how much of your code you exercised by running the test. Your tests may all pass with flying colours, but if you’ve only tested 50% of your code, how much confidence can you have in it?

Tagged : / / / / / / / / / / /

How to Differentiate Dynamic code analysis and Static code analysis?

static-dynamic-code-analysis-difference

Difference between dynamic code analysis and static code analysis

Static analysis is the testing and evaluation of an application by examining the code without executing the application whereas Dynamic analysis is the testing and evaluation of an application during runtime.

Many software defects that cause memory and threading errors can be detected both dynamically and statically. The two approaches are complementary because no single approach can find every error.

The primary advantage of dynamic analysis: It reveals subtle defects or vulnerabilities whose cause is too complex to be discovered by static analysis. Dynamic analysis can play a role in security assurance, but its primary goal is finding and debugging errors.

Level of in-depth review

The key difference between a static and dynamic code analyser is the how in-depth the code review

process is. By default, static code analysis combs through every single line of source code to find flaws and errors. For dynamic analysis, the lines of code that get reviewed depend upon which lines of source code are activated during the testing process. Unless a line of code is interacted with, the dynamic analysis tool will ignore it and continue checking active codes for flaws. As a result, dynamic analysis is a lot quicker since it is able to review code on the fly and generates real-time data. However, static code analysis provides peace of mind that each and every line of source code has been thoroughly inspected. It may take longer, but static code analysis runs in the background and is crucial for creating a flawless web application.


Catching errors early and making recommendations

The primary advantage of static analysis: It examines all possible execution paths and variable values, not just those invoked during execution. Thus static analysis can reveal errors that may not manifest themselves until weeks, months or years after release. This aspect of static analysis is especially valuable in security assurance, because security attacks often exercise an application in unforeseen and untested ways.

As mentioned before, dynamic analysis reviews codes during the testing process and generates real-time results. While it is great for fine-tuning the user experience, it has one major drawback: any errors highlighted by dynamic code analysis tools requires developers to go all the way back to the source code, make changes to the code itself and then make changes to everything that has been modified as a result of changing the source code. This is a very time consuming and expensive process; one that companies and developers like to avoid at all costs. Static code analysis tools highlight any errors immediately and allow developers to makes changes before proceeding any further. Moreover, static code analysis tools are more feature-packed than their dynamic counterparts. One important feature is the number of errors it can detect and the recommendations it can make to fix that error. If configured, static code analysers can automatically make the required changes and let developers know what changes have been made.


Cost of code analysis tools

Just like any other business, software application companies have to find a fine balance between application costs and profit margins. With respect to price, static code analysis tools are always cheaper than dynamic analysers. Moreover, having a dynamic code analyser requires a company to hire professionals trained in the use of dynamic analysis tools. A static code analysis tool can be used by any web developer with ease, thus guaranteeing that it won’t turn out to be a long-term expenditure.

Static code analysers are absolutely essential for application developers, whereas dynamic code analysers can only be used in conjunction with static analysis tools.


Tagged : / / / / / / / / / / /

Dynamic code analysis VS Static code analysis

dynamic-code-analysis-vs-static-code-analysis

Difference between dynamic code analysis and static code analysis

Static analysis is the testing and evaluation of an application by examining the code without executing the application whereas Dynamic analysis is the testing and evaluation of an application during runtime.

Many software defects that cause memory and threading errors can be detected both dynamically and statically. The two approaches are complementary because no single approach can find every error.

The primary advantage of dynamic analysis: It reveals subtle defects or vulnerabilities whose cause is too complex to be discovered by static analysis. Dynamic analysis can play a role in security assurance, but its primary goal is finding and debugging errors.

Level of in-depth review

The key difference between a static and dynamic code analyser is the how in-depth the code review

process is. By default, static code analysis combs through every single line of source code to find flaws and errors. For dynamic analysis, the lines of code that get reviewed depend upon which lines of source code are activated during the testing process. Unless a line of code is interacted with, the dynamic analysis tool will ignore it and continue checking active codes for flaws. As a result, dynamic analysis is a lot quicker since it is able to review code on the fly and generates real-time data. However, static code analysis provides peace of mind that each and every line of source code has been thoroughly inspected. It may take longer, but static code analysis runs in the background and is crucial for creating a flawless web application.


Catching errors early and making recommendations

The primary advantage of static analysis: It examines all possible execution paths and variable values, not just those invoked during execution. Thus static analysis can reveal errors that may not manifest themselves until weeks, months or years after release. This aspect of static analysis is especially valuable in security assurance, because security attacks often exercise an application in unforeseen and untested ways.

As mentioned before, dynamic analysis reviews codes during the testing process and generates real-time results. While it is great for fine-tuning the user experience, it has one major drawback: any errors highlighted by dynamic code analysis tools requires developers to go all the way back to the source code, make changes to the code itself and then make changes to everything that has been modified as a result of changing the source code. This is a very time consuming and expensive process; one that companies and developers like to avoid at all costs. Static code analysis tools highlight any errors immediately and allow developers to makes changes before proceeding any further. Moreover, static code analysis tools are more feature-packed than their dynamic counterparts. One important feature is the number of errors it can detect and the recommendations it can make to fix that error. If configured, static code analysers can automatically make the required changes and let developers know what changes have been made.


Cost of code analysis tools

Just like any other business, software application companies have to find a fine balance between application costs and profit margins. With respect to price, static code analysis tools are always cheaper than dynamic analysers. Moreover, having a dynamic code analyser requires a company to hire professionals trained in the use of dynamic analysis tools. A static code analysis tool can be used by any web developer with ease, thus guaranteeing that it won’t turn out to be a long-term expenditure.

Static code analysers are absolutely essential for application developers, whereas dynamic code analysers can only be used in conjunction with static analysis tools.


Tagged : / / / / / / / / / / / / / / / /

Difference between dynamic code analysis and static code analysis

difference-dynamic-code-analysis-and-static-code-analysis

Difference between dynamic code analysis and static code analysis

Static analysis is the testing and evaluation of an application by examining the code without executing the application whereas Dynamic analysis is the testing and evaluation of an application during runtime.

Many software defects that cause memory and threading errors can be detected both dynamically and statically. The two approaches are complementary because no single approach can find every error.

The primary advantage of dynamic analysis: It reveals subtle defects or vulnerabilities whose cause is too complex to be discovered by static analysis. Dynamic analysis can play a role in security assurance, but its primary goal is finding and debugging errors.

Level of in-depth review

The key difference between a static and dynamic code analyser is the how in-depth the code review

process is. By default, static code analysis combs through every single line of source code to find flaws and errors. For dynamic analysis, the lines of code that get reviewed depend upon which lines of source code are activated during the testing process. Unless a line of code is interacted with, the dynamic analysis tool will ignore it and continue checking active codes for flaws. As a result, dynamic analysis is a lot quicker since it is able to review code on the fly and generates real-time data. However, static code analysis provides peace of mind that each and every line of source code has been thoroughly inspected. It may take longer, but static code analysis runs in the background and is crucial for creating a flawless web application.


Catching errors early and making recommendations

The primary advantage of static analysis: It examines all possible execution paths and variable values, not just those invoked during execution. Thus static analysis can reveal errors that may not manifest themselves until weeks, months or years after release. This aspect of static analysis is especially valuable in security assurance, because security attacks often exercise an application in unforeseen and untested ways.

As mentioned before, dynamic analysis reviews codes during the testing process and generates real-time results. While it is great for fine-tuning the user experience, it has one major drawback: any errors highlighted by dynamic code analysis tools requires developers to go all the way back to the source code, make changes to the code itself and then make changes to everything that has been modified as a result of changing the source code. This is a very time consuming and expensive process; one that companies and developers like to avoid at all costs. Static code analysis tools highlight any errors immediately and allow developers to makes changes before proceeding any further. Moreover, static code analysis tools are more feature-packed than their dynamic counterparts. One important feature is the number of errors it can detect and the recommendations it can make to fix that error. If configured, static code analysers can automatically make the required changes and let developers know what changes have been made.


Cost of code analysis tools

Just like any other business, software application companies have to find a fine balance between application costs and profit margins. With respect to price, static code analysis tools are always cheaper than dynamic analysers. Moreover, having a dynamic code analyser requires a company to hire professionals trained in the use of dynamic analysis tools. A static code analysis tool can be used by any web developer with ease, thus guaranteeing that it won’t turn out to be a long-term expenditure.

Static code analysers are absolutely essential for application developers, whereas dynamic code analysers can only be used in conjunction with static analysis tools.


Tagged : / / / / / / / / / / / / /

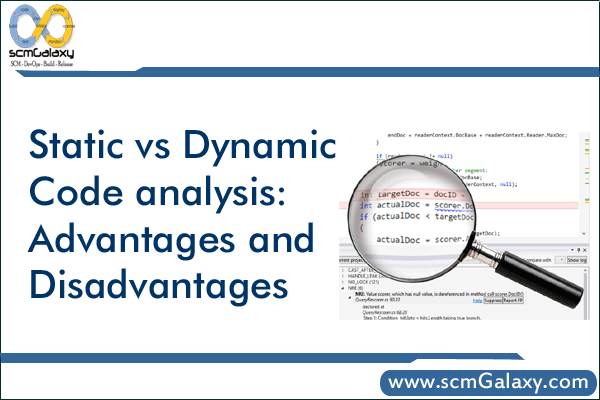
Static vs dynamic code analysis: Advantages and Disadvantages

static-vs-dynamic-code-analysis-advantages-and-disadvantages

What are the advantages and limitations of static and dynamic software code analysis? Maj. Michael Kleffman of the Air Force’s Application Software Assurance Center of Excellence spelled it out.

Static code analysis advantages:

  1. It can find weaknesses in the code at the exact location.
  2. It can be conducted by trained software assurance developers who fully understand the code.
  3. It allows a quicker turn around for fixes.
  4. It is relatively fast if automated tools are used.
  5. Automated tools can scan the entire code base.
  6. Automated tools can provide mitigation recommendations, reducing the research time.
  7. It permits weaknesses to be found earlier in the development life cycle, reducing the cost to fix.

Static code analysis limitations:

  1. It is time consuming if conducted manually.
  2. Automated tools do not support all programming languages.
  3. Automated tools produce false positives and false negatives.
  4. There are not enough trained personnel to thoroughly conduct static code analysis.
  5. Automated tools can provide a false sense of security that everything is being addressed.
  6. Automated tools only as good as the rules they are using to scan with.
  7. It does not find vulnerabilities introduced in the runtime environment.

Dynamic code analysis advantages:

  1. It identifies vulnerabilities in a runtime environment.
  2. Automated tools provide flexibility on what to scan for.
  3. It allows for analysis of applications in which you do not have access to the actual code.
  4. It identifies vulnerabilities that might have been false negatives in the static code analysis.
  5. It permits you to validate static code analysis findings.
  6. It can be conducted against any application.

Dynamic code analysis limitations:

  1. Automated tools provide a false sense of security that everything is being addressed.
  2. Automated tools produce false positives and false negatives.
  3. Automated tools are only as good as the rules they are using to scan with.
  4. There are not enough trained personnel to thoroughly conduct dynamic code analysis [as with static analysis].
  5. It is more difficult to trace the vulnerability back to the exact location in the code, taking longer to fix the problem.
Tagged : / / / / / / / / / / / / / / /

How to use Gerrit to enhance your Code Analysis?

gerrit-to-enhance-your-git/

Check the video at the bottom of the page.

Click here

Tagged : / / / / / / / / / / / / / /

What is Code Coverage and Why Code Coverage?

code-coverage

What is Code Coverage
Code Coverage is an important measurement in Software Quality Engineering. While Software testing ensures correctness of the applications, a metric is required to track the What is Code Coverage Code Coverage is an important measurement in Software Quality Engineering. While Software testing ensures correctness of the applications, a metric is required to track the completeness and effectiveness of the testing undertaken. Code Coverage helps achieve reliable quality through identifying untested areas of the application.

Why Code Coverage
Software testing is a challenging function. The testers need to ensure complete functional and non-functional correctness of the product. Considering the complex workflows and use cases of modern day applications, the number of unique cases that the software can be used often run into millions, which is not feasible to be covered under testing exercise. The testers thus need to
– While Planning Tests
o Ensure covering all workflows in terms of decision trees in the code
o Ensure covering all data values – by identifying patterns rather covering millions of values
– While testing
o Ensuring the testing is completely exercising the whole application with planned and exploratory tests.

At the end of testing, the decision to stop testing and release the product still remains subjective, based on the presence or absence of bugs, inflow of new bugs, success rate of each test cycle, confidence rating of the testers or users, etc. Whereas the definitive metric of quantifying how much of the application was really tested, is missed.

Code Coverage is measured as quantification of application code exercised by the testing activities. Code Coverage can be measured at various levels – in terms of programming language constructs – Packages, Classes, Methods, Branches or in terms of physical artifacts – Folders, Files and Lines. For Eg. A Line Coverage metric of 67% means the testing exercised 67% of all executable statements of the application. A Code Coverage metric usually is accompanied by Code Coverage Analysis Report – which helps identify the un-tested part of the application code, thereby giving the testers early inputs for complete testing.

Benefits of Code Coverage

  • Objective Indicator of Test Coverage of application code
  • Pointers to uncovered Packages / Classes / Methods / Branches
  • Pointers to uncovered Folders / Files / Lines
  • Drill down to untested part of source code and devise new tests
  • Early Indicator for Testing Quality and Fixing it by adding new tests.
  • Remove redundancy in testing
  • Increased Confidence for Releases

Test Your Test

Typical Emotional Storyboard

  • Write Some code! Happy!
  • Does it work? Sad!
  • Write some test! Happy!
  • Do they really test the code? Sad!
  • Measure the Code Coverage! Happy!

Coverage Measurement

  1. Shows Which line of code are executed
  2. How much of your code is covered by your tests?
  3. Your tests test your product
  4. Coverage testing tests your tests

Goal

  • 100%
  • Coverage Ideal
  • Not Always possible
  • Can be expensive to achieve
  • Design for testability

Good: Write more tests
Only way to truly increase code coverage

Bad
Excluding Code to boost Coverage

Types of Coverage

  1. Statement Coverage
  2. Branch Coverage
  3. Path Coverage
  4. Loop Path Coverage
  5. Data – driven Code
  6. Complex Conditionals
  7. Hidden Branches

How; – Coverage Tools

  1. Clover
  2. Cobertura
  3. Emma
Tagged : / / / / / / / / / / / / /

Overview of EMMA | Code Coverage Tool – EMMA

emma-overviewOverview

EMMA is a tool for measuring coverage of Java software. Such a tool is essential for detecting dead code and verifying which parts of your application are actually exercised by your test suite and interactive use.
EMMA’s design strives for several, very elusive in their combination, goals:

  • report rich coverage analysis data without introducing significant overhead during either build or execution time
  • be useful in team development environments, while at the same time enabling fast individual develop-test cycle
  • support quick development and testing of small standalone Java applications as well as scale up to massive enterprise sotfware suites containing thousands of Java classes

Advantages of Emma over other coverage tools

EMMA differs from other coverage tools in its extreme orientation towards fast iterative develop-test style of writing software. JVM Profiler Interface (JVMPI)-based tools do not require an instrumented source build, but the runtime overhead of running with JVMPI on is empirically known to be very high and results in depressingly slow testsuite runs. For tools based on source code instrumentation, having to wait for a full source code rebuild just to check coverage metrics is not something a normal developer wants to do several times during a day. EMMA’s goal is to be so unintrusive that frequent daily checking of coverage numbers becomes second nature to every developer on the team, if not a completely automatic byproduct of every test run.

Install and Configuration

Method 1: To run on Command Line.
Copying emma.jar to <your jre dir>/lib/ext/ directory for whichever JRE you use from command line.
Method 2:
Still, if you are wary of adding a third-party library as a standard JRE extension, just make sure that all your EMMA command line invocations add emma.jar to the JVM classpath:
>java -cp …/lib/emma.jar <emma or emmarun command>

Implementing EMMA with Application

  • On the Fly Mode – Based suited for Standalone Application
  • Offline Mode – Best suited for J2EE framework based application

Implement EMMA in J2EE project {WebLogic, Websphere, Tomcat, JBoss, …}?

There are very less opportunities given by Emma that  you would be able setup emma for J2EE Project on the fly mode. The reason behind this to fact that many J2EE features requires specialized class loading that will happen outside EMMA instrumenting class holder. The server might run fine but you will unlikely to get EMMA report.
So, based Procedures to Instrument your classes prior to deployment (offline mode); offline instrumentation always follows the same compile / instrument / Package / deploy / get coverage / Generate report sequence.
There are following steps need to follow to implement EMMA in J2EE based project…

  • Use EMMA’s instr tool to instrument the desire classes. This can be done a post compilation step, before packaging. However many users also find it convenient to let EMMA process their jars directly (either in place, using overwrite mode, or by creating separate instrumented copies of everything, fullcopy mode.
  • do your J2EE packaging as normal, but do not include emma.jar as a lib at this level, that is, within your .war, .ear, etc;
  • locate whichever JRE is used by the container and copy emma.jar into its <jre dir>/lib/ext directory. If that is impossible, add emma.jar to the server classpath (in a server-specific way);
  • deploy your instrumented classes, .jars, .wars, .ears, etc and exercise/test your J2EE application via your client-side testcases or interactively or whichever way you do it;
  • to get a coverage dump file, you have three options described. It is highly recommended that you use coverage.get  control command with the ctl tool available in v2.1.

Notes:

Reference:
http://emma.sourceforge.net/faq.html#q.runtime.appservers
http://emma.sourceforge.net/reference/ch02s03.html#tool-ref.instr.outmodes

Emma Integration with other tools

Emma Integration with Sonar
Emma Integration with Hudson
Emma Integration with CruiseControl

jar instrumentation using Emma

http://primates.ximian.com/~flucifredi/emma-HOWTO.html
http://emma.sourceforge.net/reference/ch02s03.html#tool-ref.instr.outmodes
http://primates.ximian.com/~flucifredi/emma-HOWTO.html
http://groovy.329449.n5.nabble.com/EMMA-Code-Coverage-has-problem-with-Groovy-classes-td360560.html

Tagged : / / / / / / / / / /