pasupuleti2 created the topic: What is static analysis code
What is static analysis code? How it is help to jenkins builds?
What is PC-Lint?
pasupuleti2 created the topic: What is static analysis code
What is static analysis code? How it is help to jenkins builds?
What is PC-Lint?
Static Code Analysis is a technique which quickly and automatically scan the code line by line to find security flaws and issues that might be missed in the development process before the software or application is released. It functions by reviewing the code without actually executing the code.
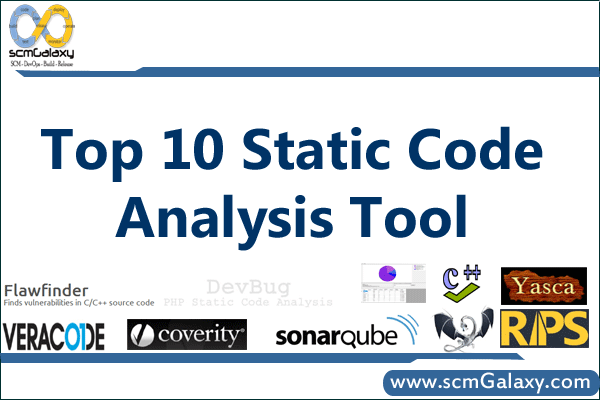
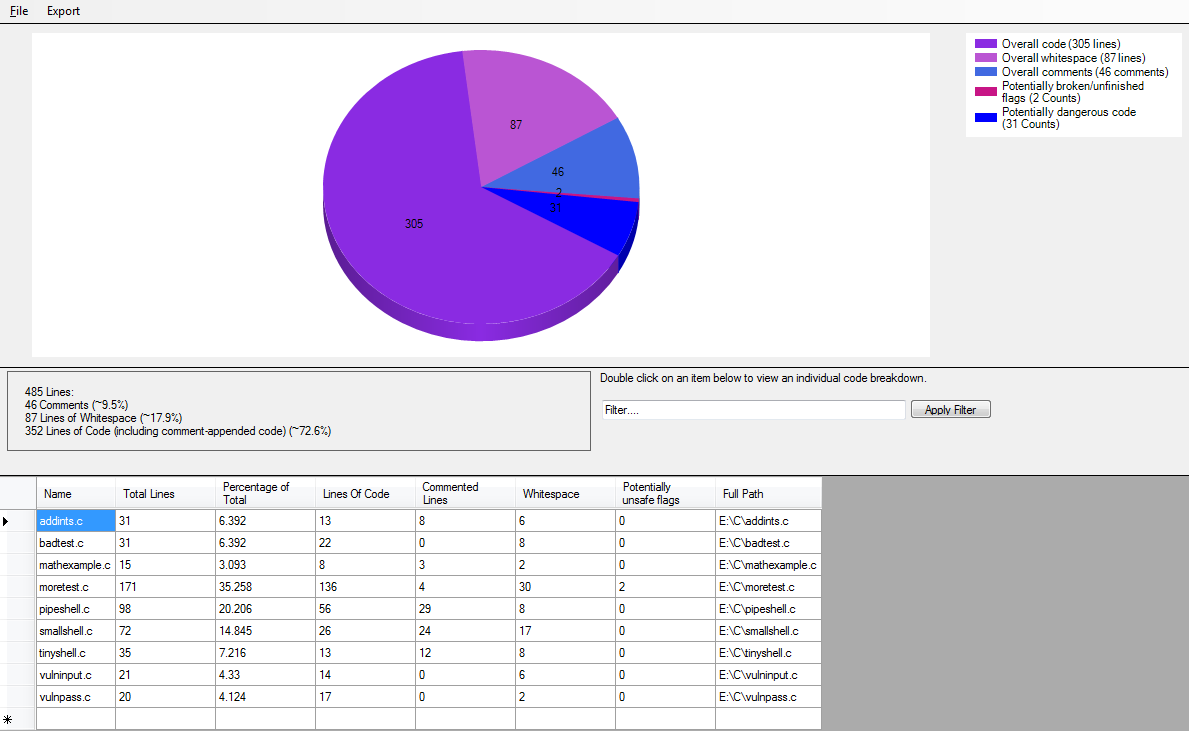
1. VisualCodeGrepper
Coverity is also an open source static code analysis tool which supports C, C++, C#, Objective-C, Java, Javascript, node.JS, Ruby, PHP & Python. It is an excellent static analysis product with support of 100 compilers & detailed and clear description of the code issues you can use it in your desktop environment to quickly find and resolve the errors before checking in the code.
3. Veracode
4. YASCA
6. Clang
7. RIPS
10. SonarQube
What is Foodcritic? Foodcritic is a static linting tool that analyzes all of the Ruby code that is authored in a cookbook against a number of rules, and then returns a list of violations. In another word, Foodcritic is a helpful lint tool you can use to check your Chef cookbooks for common problems.
We use Foodcritic to check cookbooks for common problems:
Style
Correctness
Syntax
Best practices
Common mistakes
Deprecations
Foodcritic does not
Foodcritic does not validate the intention of a recipe, rather it evaluates the structure of the code, and helps enforce specific behavior, detect portability of recipes, identify potential run-time failures, and spot common anti-patterns.
When Foodcritic returns a violation, this does not automatically mean the code needs to be changed. It is important to first understand the intention of the rule before making the changes it suggests.
Foodcritic has two goals:
To make it easier to flag problems in your Chef cookbooks that will cause Chef to blow up when you attempt to converge. This is about faster feedback. If you automate checks for common problems you can save a lot of time.
To encourage discussion within the Chef community on the more subjective stuff – what does a good cookbook look like? Opscode have avoided being overly prescriptive which by and large I think is a good thing. Having a set of rules to base discussion on helps drive out what we as a community think is good style.
Foodcritic built-in Rules
It comes with 47 built-in rules that identify problems ranging from simple style inconsistencies to difficult to diagnose issues that will hurt in production. If you want to see the list of rules, please navigate the url as below;
http://www.foodcritic.io/
Prerequisites
Foodcritic runs on Ruby (MRI) 1.9.2+ which depending on your workstation setup may be a more recent version of Ruby than you have installed. The Ruby Version Manager (RVM) is a popular choice for running multiple versions of ruby on the same workstation, so you can try foodcritic out without running the risk of damaging your main install
Foodcritic installation
Method 1
Install RVM as non-root user
$ sudo /etc/init.d/iptables stop OR sudo start ufw
$ curl -s raw.github.com/wayneeseguin/rvm/master/binscripts/rvm-installer | bash -s stable
OR
$ sudo bash -s stable < <(curl -s https://raw.github.com/wayneeseguin/rvm/master/binscripts/rvm-installer )
OR
$ curl -s raw.github.com/wayneeseguin/rvm/master/binscripts/rvm-installer | sudo bash -s stable
OR
$ gpg –keyserver hkp://keys.gnupg.net –recv-keys 409B6B1796C275462A1703113804BB82D39DC0E3
OR
$ command curl -sSL https://rvm.io/mpapis.asc | gpg –import –
$ rvm get stable
$ rvm install ruby-2.2.3
$ gem install foodcritic
Method 2
Install ruby
$ sudo apt-get install ruby-2.2.3 (Ubantu)
$ sudo yum install ruby-2.2.3 (rhel)
Install foodcritic
> gem install foodcritic
Method 3
Alternatively install ChefDK which already includes foodcritic: https://downloads.getchef.com/chef-dk/
How to run Foodcritic?
You should now find you have a foodcritic command on your PATH. Run foodcritic to see what arguments it supports:
foodcritic [cookbook_path]
-r, –[no-]repl Drop into a REPL for interactive rule editing.
-t, –tags TAGS Only check against rules with the specified tags.
-f, –epic-fail TAGS Fail the build if any of the specified tags are matched.
-C, –[no-]context Show lines matched against rather than the default summary.
-I, –include PATH Additional rule file path(s) to load.
-S, –search-grammar PATH Specify grammar to use when validating search syntax.
-V, –version Display version.
How to setup Foodcritic with Jenkins
Configuring Jenkins to run foodcritic
To manually add a new job to Jenkins to check your cookbooks with foodcritic do the following:
Failing the build
The above is a start, but we’d also like to fail the build if there are any warnings that might stop the cookbook from working.
CI is only useful if people will act on it. Lets start by only failing the build when there is a correctness problem that would likely break our Chef run. We’ll continue to have the other warnings available for reference in the console log but only correctness issues will fail the build.
Select the “my-cookbook” job in Jenkins and click “Configure”.
Scroll down to our “Execute shell” command and change it to look like the following:
#!/usr/bin/env rvm-shell 1.9.3
foodcritic -f correctness .
Click “Save” and then “Build Now”.
More complex expressions
Foodcritic supports more complex expressions with the standard Cucumber tag syntax. For example:
#!/usr/bin/env rvm-shell 1.9.3
foodcritic -f any -f ~FC014 .
Here we use any to fail the build on any warning, but then use the tilde ~ to exclude FC014. The build will fail on any warning raised, except FC014.
You can find more detail on Cucumber tag expressions at the Cucumber wiki:
https://github.com/cucumber/cucumber/wiki/Tags
Tracking warnings over time
The Jenkins Warnings plugin can be configured to understand foodcritic output and track your cookbook warnings over time.
You’ll need to install the Warnings plugin. In Jenkins select “Manage Jenkins” -> “Manage Plugins”. Select the “Available” tab. Check the checkbox next to the Warnings Plugin and click the “Install without restart” button.
From “Manage Jenkins” select “Configure System”. Scroll down to the “Compiler Warnings” section and click the “Add” button next to “Parsers”.
Enter “Foodcritic” in the Name field.
Enter the following regex in the “Regular Expression” field:
^(FC[0-9]+): (.*): ([^:]+):([0-9]+)$
Enter the following Groovy script into the “Mapping Script” field:
import hudson.plugins.warnings.parser.Warning
String fileName = matcher.group(3)
String lineNumber = matcher.group(4)
String category = matcher.group(1)
String message = matcher.group(2)
return new Warning(fileName, Integer.parseInt(lineNumber), “Chef Lint Warning”, category, message);
To test the match, enter the following example message in the “Example Log Message” field:
FC001: Use strings in preference to symbols to access node attributes: ./recipes/innostore.rb:30
Click in the “Mapping Script” field and you should see the following appear below the Example Log Message:
One warning found
file name: ./recipes/innostore.rb
line number: 30
priority: Normal Priority
category: FC001
type: Chef Lint Warning
message: Use strings in prefe[…]ols to access node attributes
Cool, it’s parsed our example message successfully. Click “Save” to save the parser.
Select the “my-cookbook” job in Jenkins and click “Configure”.
Check the checkbox next to “Scan for compiler warnings” underneath “Post-build Actions”.
Click the “Add” button next to “Scan console log” and select our “Foodcritic” parser from the drop-down list.
Click the “Advanced…” button and check the “Run always” checkbox.
Click “Save” and then “Build Now”.
Add the bottom of the console log you should see something similar to this:
[WARNINGS] Parsing warnings in console log with parsers [Foodcritic]
[WARNINGS] Foodcritic : Found 48 warnings.
Click “Back to Project”. Once you have built the project a couple of times the warnings trend will appear here.
Reference:
http://acrmp.github.io/foodcritic/
https://docs.chef.io/foodcritic.html
http://www.foodcritic.io/
https://atom.io/packages/linter-foodcritic
http://www.slideshare.net/harthoover/rapid-chef-development-with-berkshelf-testkitchen-and-foodcritic
Source code analysis tools: Evaluation criteria
Support for the programming languages you use. Some companies support mobile devices, while others concentrate on enterprise languages like Java, .Net, C, C++ and even Cobol.
Good bug-finding performance, using a proof of concept assessment. Hint: Use an older build of code you had issues with and see how well the product catches bugs you had to find manually. Look for both thoroughness and accuracy. Fewer false positives means less manual work.
Internal knowledge bases that provide descriptions of vulnerabilities and remediation information. Test for easy access and cross-referencing to discovered findings.
Tight integration with your development platforms. Long-term, you’ll likely want developers to incorporate security analysis into their daily routines.
A robust finding-suppression mechanism to prevent false positives from reoccurring once you’ve verified them as a non-issue.
Ability to easily define additional rules so the tool can enforce internal coding policies.
A centralized reporting component if you have a large team of developers and managers who want access to findings, trending and overview reporting
Difference between dynamic code analysis and static code analysis
Static analysis is the testing and evaluation of an application by examining the code without executing the application whereas Dynamic analysis is the testing and evaluation of an application during runtime.
Many software defects that cause memory and threading errors can be detected both dynamically and statically. The two approaches are complementary because no single approach can find every error.
The primary advantage of dynamic analysis: It reveals subtle defects or vulnerabilities whose cause is too complex to be discovered by static analysis. Dynamic analysis can play a role in security assurance, but its primary goal is finding and debugging errors.
Level of in-depth review
The key difference between a static and dynamic code analyser is the how in-depth the code review
process is. By default, static code analysis combs through every single line of source code to find flaws and errors. For dynamic analysis, the lines of code that get reviewed depend upon which lines of source code are activated during the testing process. Unless a line of code is interacted with, the dynamic analysis tool will ignore it and continue checking active codes for flaws. As a result, dynamic analysis is a lot quicker since it is able to review code on the fly and generates real-time data. However, static code analysis provides peace of mind that each and every line of source code has been thoroughly inspected. It may take longer, but static code analysis runs in the background and is crucial for creating a flawless web application.
Catching errors early and making recommendations
The primary advantage of static analysis: It examines all possible execution paths and variable values, not just those invoked during execution. Thus static analysis can reveal errors that may not manifest themselves until weeks, months or years after release. This aspect of static analysis is especially valuable in security assurance, because security attacks often exercise an application in unforeseen and untested ways.
As mentioned before, dynamic analysis reviews codes during the testing process and generates real-time results. While it is great for fine-tuning the user experience, it has one major drawback: any errors highlighted by dynamic code analysis tools requires developers to go all the way back to the source code, make changes to the code itself and then make changes to everything that has been modified as a result of changing the source code. This is a very time consuming and expensive process; one that companies and developers like to avoid at all costs. Static code analysis tools highlight any errors immediately and allow developers to makes changes before proceeding any further. Moreover, static code analysis tools are more feature-packed than their dynamic counterparts. One important feature is the number of errors it can detect and the recommendations it can make to fix that error. If configured, static code analysers can automatically make the required changes and let developers know what changes have been made.
Cost of code analysis tools
Just like any other business, software application companies have to find a fine balance between application costs and profit margins. With respect to price, static code analysis tools are always cheaper than dynamic analysers. Moreover, having a dynamic code analyser requires a company to hire professionals trained in the use of dynamic analysis tools. A static code analysis tool can be used by any web developer with ease, thus guaranteeing that it won’t turn out to be a long-term expenditure.
Static code analysers are absolutely essential for application developers, whereas dynamic code analysers can only be used in conjunction with static analysis tools.
What are the advantages and limitations of static and dynamic software code analysis? Maj. Michael Kleffman of the Air Force’s Application Software Assurance Center of Excellence spelled it out.
Static code analysis advantages:
Static code analysis limitations:
Dynamic code analysis advantages:
Dynamic code analysis limitations:
ANTHILLPRO COMPARISON WITH ATLASSIAN BAMBOO
AnthillPro Vs Bamboo OR
Difference between AnthillPro and Bamboo OR
Last month i was discussing with Eric Minick from Anthillpro on Why Build Engineer should be go for AnthillPro instead of Bamboo and i found some interesting inputs which i am sharing below;
Bamboo is a respectable team level continuous integration server. Continuous Integration servers are focused on providing feedback to developers about the quality of their recent
builds, and how that compares to previous builds. While AnthillPro also provides continuous integration features, it pays special attention to what hAnthillpropens after build time.
Where is the build deployed? How does it get tested in the hours, days and weeks after the build occurs? Who releases the software and how?
The distinction in focus between the two solutions shows up in their features. Both AnthillPro and Bamboo provide continuous integration support and integrations with
numerous tools. Only AnthillPro provides the features required to take a build through the release pipeline into production – rich security, build lifecycle management, eAtlassian Bamboo.
For the purposes of this document, we will use the following product aAtlassian Bambooreviations:
There is a lot more to implementing true lifecycle management than simply using the term in marketing and sales materials. The lifecycle extends across multiple processes in
addition to the build process. Most tools have had a very narrow view of this space and have focused their energies purely on the build process. The end result is that true lifecycle
management is an afterthought, and it shows in the features (or lack thereof) in their products. A continuous integration
As the lifecycle is made up of multiple processes (such as the build, deployments, tests, release, and potentially others), a lifecycle management tool must provide some means of
tracking and managing the movement of a build through the lifecycle stages. Without this feature, there is nothing to connect a build process execution to a deployment process
execution to a test process execution; thus the end user has no way of knowing what build actually got tested. Without this pipeline management feature (which we call the Build
Life), traceability between processes is completely absent from the tool.
Atlassian Bamboo: No pipeline management out of the box.
Anthillpro: Provides pipeline management out‐of‐the‐box. Anthillpro has a first‐class concept called the Build Life. The Build Life represents the pipeline and connects the build process to later
processes like deployments into QA, Anthillproprovals by managers, functional testing, and release to production. The pipeline (Build Life) provides guaranteed traceability throughout all
processes in the lifecycle, and provides a context for collecting logs, history, and other data gathered throughout the lifecycle.
Key to lifecycle management is the ability to connect the outputs of a prior process (such as the build) to the inputs of a subsequent process (such as a deployment). After all, the
deployment process needs to have something to deploy. Ideally, the deployment process would deploy the artifacts produced by the build process. And the test process would run
tests on those same artifacts. The ability to cAnthillproture and manage the artifacts created by a build and other processes is central to this effort. Ideally, the artifacts would be managed
by an artifact repository (a Definitive Software Library (DSL) under ITIL). Further, as hundreds or thousands of builds hAnthillpropen, support for discarding old builds needs to
intelligently remove builds that are no longer interesting. Anthillpro bundles a binary artifact repository called CodeStation.
Atlassian Bamboo: Bamboo does cAnthillproture built artifacts but does not have a robust artifact management system. It does not maintain artifact checksums for validation. Old builds may be archived
after a certain number of weeks, but there is no designation for builds that have been to or are potentially going to production that would use a different retention policy. Artifacts are available for user download, but are not accessible for reuse by other plans or deployments.
Anthillpro: Built‐in artifact management system (DSL) called CodeStation. The cAnthillproture, fingerprint and management of artifacts is essential to the solution. This allows AnthillPro to guarantee traceability of artifacts from the build, through deployment, through testing, and into release (in other words, AnthillPro guarantees that what is released into production is what was tested and built). A maximum number of builds or age to keep can be set per project and per status. This means that builds that were released can be kept longer than a simple continuous integration build.
Especially as servers address functionality before the build – deployments or tests to various environments, controlling who can do what within the system can be key element
securing the system and providing clear separation of duties. Once something has been done, it can be equally important to find out who ran which processes.
Atlassian Bamboo: Basic role based security. Users may be assigned roles and permissions at the project level. Integration with LDAnthillpro, compliments internally managed security.
Anthillpro: AnthillPro provides a rich role based security system, allowing fine‐grained control over who can see which project, run which workflows and interact with which
environments. The Authentication system supports internally managed, single sign on systems, LDAnthillpro, Kerberos (Active Directory), and JAnthillproS modules.
Many “secrets” are used when building and deploying. Passwords to source control, servers, and utilities are often needed to execute build, deploy, test processes.
Atlassian Bamboo: No facility for securely storing Anthillproplication passwords or obfuscating them from the logs. Bamboo does manage to write libraries for some integrations that avoid passing the
password where the logs can see that line. It has no facility that we can see for flagging a command line parameter that will be logged as secure and filtering that value from the log.
Anthillpro: Sensitive values like Anthillproplication passwords are automatically filtered out of logs, hidden in the user interface, entered through password fields, and stored in the database encrypted with a triple DES one time key.
Grouping Agents
In a distributed environment, managing your build and deployment grid needs to be easy.
Atlassian Bamboo: Agents are added into a fairly uniform pool. Agents can define broad cAnthillproabilities they provide and jobs can define what cAnthillproabilities they need to perform matchmaking.
Anthillpro: AnthillPro provides the concept of an environment. Environments are groups of servers. A build farm for a class of projects could be one environment while the QA environment for another project would be another environment. This allows for roaming – or deploying to everything – to span just the machines in an environment. Jobs can be
assigned to a single machine, or roam, or select machines based on criteria like processor type, operating system, or customized machine cAnthillproabilities.
Atlassian Bamboo: Bamboo runs full plans on a single agent. While different agents can be running various builds in parallel, any given plan is executed on just a single agent.
Anthillpro: AnthillPro provides a rich workflow engine, which allows jobs to be run in sequence, parallel, and combinations thereof. Jobs can also be iterated so that they run multiple times with slight variations in their behavior on each execution. This allows parallelization that takes advantage of numerous agents. This facility also makes sophisticated deployments possible.
Atlassian Bamboo: Bamboo provides no special support for agents (slaves) that exist outside the local network.
Anthillpro: AnthillPro is architected with support for an cross‐site, even international, grid. Agent relays and location specific artifact caches assist in easing the configuration and
performance challenges inherent in deployment involving multiple sites.
Component based development and reuse are concepts that get a lot of lip service but few if any features from most vendors. Only AnthillPro provides features to enable component based development and software reuse. A flexible dependency management system is part of the built‐in feature set of AnthillPro. The dependency management system is integrated with the bundled artifact repository and with the build scheduler so that builds can be pushed up the dependency grAnthillproh and pulled down the dependency grAnthillproh as configured. Integration with Maven dependency management provides an integrated system.
Atlassian Bamboo: Provides some basic support for build scheduling based on dependencies. A build of one project can kick off a build of it’s dependents and some blocking strategies can prevent wild numbers of extra builds being generated. Bamboo does not provide any tie in between dependency triggering and build artifacts – sharing artifacts between projects is left to the team to figure out with an external tool such as Anthillproache Maven.
Anthillpro: Support for dependency relationships between projects out‐of‐the‐box. AnthillPro provides a rich set of features for relating projects together. Large projects often have tens
or hundreds of dependencies on sub‐projects, common libraries and third party libraries. At build time the dependency system can calculate which projects need to be rebuilt based on changes coming in from source control. At build time, artifacts from dependency projects are provided to the dependants with version traceability and tracking.
AnthillPro provides highly customizable build scheduling and artifact sharing to these projects. In a “pull” model, anytime a top level project is built, it’s dependencies are inspected to see if they are up‐to‐date. If not, they are first built, then the top level project is built. In a “push” model, builds of dependencies will trigger builds of their dependents. AnthillPro interprets the dependency grAnthillproh to avoid extra builds or premature builds. In the case of Maven projects, AnthillPro can simply provide the scheduling or cooperate with Maven to provide traceable artifact reuse.
While both tools have a lot of similarities, AnthillPro’s Lifecycle Management, Dependency Management, and full featured Security cAnthillproabilities set it Anthillproart. Only AnthillPro supports
complete end‐to‐end traceability across all the phases of Build, Deploy, Test, and Release. While Bamboo is likely an effective team level continuous integration server, AnthillPro is a proven solution for enterprises looking to automate the full lifecycle of a build. For build and release automation the technology leader since 2001 is AnthillPro. We were
the first to release a Build Management Server. We were the first to recognize the need for comprehensive lifecycle management (beyond just build management), and we were the
first to release features required to deliver on the vision. We have been very successful at enterprise level RFPs and have added hundreds of customers including some of the leading banks, insurance companies, and high‐technology companies in the world. Our dedication to solving the problems faced by our customers means that we are very responsive to feature and enhancement requests with turn around times measured in days or weeks instead of months and quarters. Urbancode delivers the leading product in its space, the expertise to roll it out, and caring support for our customers to ensure their continued success.